USA Population Spike Map Reveals Unprecedented Growth Hotspots
The United States experienced a dramatic rise in population density from 2020 to 2022, a trend that has left many cities scrambling to accommodate new residents. The latest maps illustrate a stark concentration of growth in the South and Midwest, with some metropolitan corridors swelling by nearly 10% in just two years. This surge not only reshapes the demographic landscape but also poses fresh challenges for planners, developers, and policymakers nationwide.
Mapping the Surge: Where the Numbers Soar
Using high‑resolution satellite imagery, the Population Density Map highlights the most densely populated counties and cities. Notable hotspots include the Dallas‑Fort Worth area, Atlanta, and Charlotte, each seeing population jumps that outpace national averages. Rural pockets in the Midwest, such as counties around Omaha and Des Moines, have also experienced rapid inflows, driven by telecommuting trends and lower living costs. The map underscores a shift toward suburban and exurban regions, where residents are seeking larger homes and more space while staying within reach of urban amenities.

State‑Level Shifts: From the South to the Northeast
The United States population change map for 2020‑2022 reveals stark state‑by‑state variations. Southern states such as Texas, Florida, and Georgia show the highest net gains, with Texas alone adding over 1.4 million residents. In contrast, several Northeastern states have seen modest declines or stagnant growth, as aging populations and higher living costs temper inflows. The map also points to emerging growth corridors in the Great Plains and the Upper Midwest, suggesting a redistribution of economic activity beyond traditional coastal strongholds.

Implications for Infrastructure and Housing
Rapid population spikes are placing unprecedented pressure on infrastructure systems. Roads, public transit, and utilities are already strained in many high‑growth counties, leading to congestion, longer commute times, and rising maintenance costs. Housing markets, too, are reacting strongly; demand surges have pushed median home prices upward by 8% on average, exacerbating affordability concerns in key metros. Local governments are responding with mixed strategies, from expanding public transportation networks to incentivizing mixed‑use developments that blend residential and commercial space.
Future Outlook and Policy Directions
Forecasts indicate that the upward trend may continue if current economic and demographic drivers persist. Policymakers face the task of balancing growth with sustainability, ensuring that infrastructure investments keep pace with population shifts while protecting environmental resources. Strategic zoning reforms, investment in green transportation, and targeted housing subsidies are among the measures being debated. As the nation adapts to its new population distribution, the maps serve as both a diagnostic tool and a roadmap for the next decade of urban planning.
United States Population Density Map 2022

United States Population Density Map 2022
Us Map Showing Population US Population Growth Smallest In At Least

Us Map Showing Population US Population Growth Smallest In At Least
Us Population Density Map 2022

Us Population Density Map 2022
North American Population Map

North American Population Map
Us Population Density Map 2022

Us Population Density Map 2022
Us Population Density Map 2022

Us Population Density Map 2022
United States Population Density Map 2022

United States Population Density Map 2022
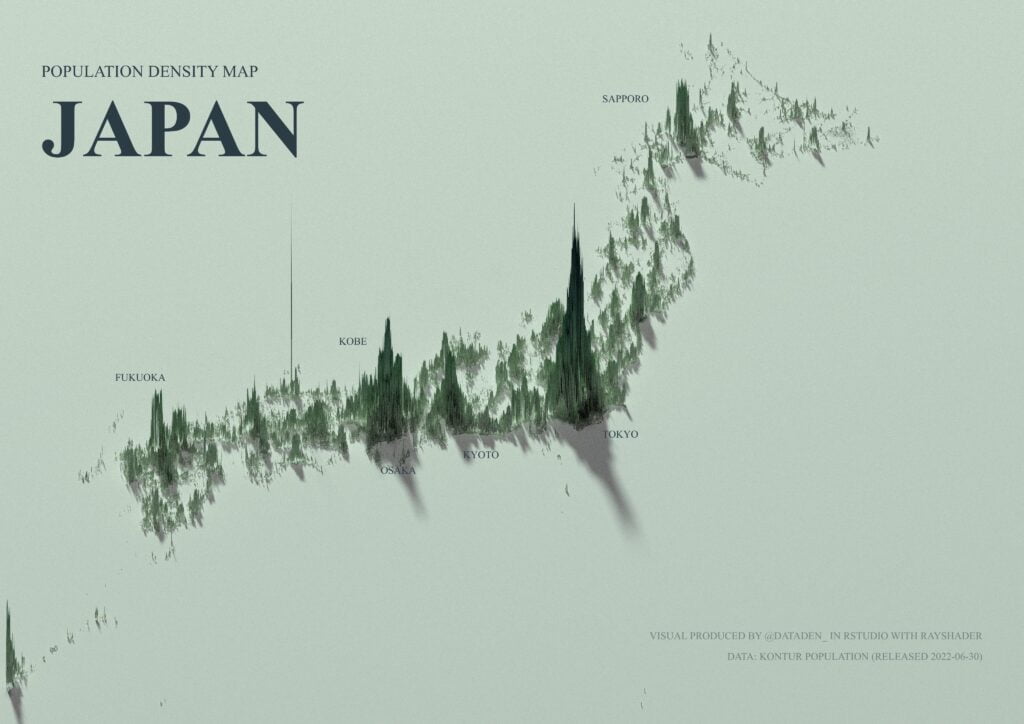
Detailed ‘spike Maps’ Show World’s Population Clusters…

Detailed ‘spike maps’ show world’s population clusters…
Map Shows The Population Change Across US Counties Between 2020 And

Map shows the population change across US counties between 2020 and ...
Denver Metro Area Sees Population Spike Thanks To Immigration - Axios

Denver metro area sees population spike thanks to immigration - Axios ...
Render 3D Spikes Based On Population Data In QGIS? - Geographic

Render 3D spikes based on population data in QGIS? - Geographic ...
United States Population Density Map 2022

United States Population Density Map 2022
Us Population Density Map 2022

Us Population Density Map 2022
VividMaps — Population Growth In The U.S. Mapped...

VividMaps — Population Growth in the U.S. mapped...
US Population Change Map Over Time

US Population Change Map Over Time
Us Population Density Map 2022

Us Population Density Map 2022
Us Population Density Map 2022

Us Population Density Map 2022
Us Population Density Map 2022

Us Population Density Map 2022
The Decade Every U.S. County Peaked In Population As Recorded By The US

The Decade Every U.S. County Peaked In Population As Recorded by the US ...
United States Population Density Map 2022

United States Population Density Map 2022
United States Population Density Map 2022

United States Population Density Map 2022
United States Population Density Map 2022

United States Population Density Map 2022
Us Population Density Map 2022

Us Population Density Map 2022
United States Population Density Map 2022

United States Population Density Map 2022
Us Population Density Map 2022

Us Population Density Map 2022
Us Population Density Map 2022

Us Population Density Map 2022
Us Population City Vs Rural _ Urban Population Usa 2020 – CLIDM

Us Population City Vs Rural _ Urban Population Usa 2020 – CLIDM
Population Map Of The World 2022
Population Map Of The World 2022
How The US Population Changed In 40 Years From 1982 To 2022 In 2025

How The US Population Changed In 40 Years From 1982 to 2022 in 2025 ...
Percent Change In Population By US County: 2020 To... - Maps On The Web

Percent Change in Population by US County: 2020 to... - Maps on the Web
US Population Map - Guide Of The World

US Population Map - Guide of the World
