US Population Density Rankings: Who's Packing the Most People?
In the United States, population density isn’t just a number on a chart—it’s the secret sauce behind how crowded your coffee shop might be, how often you see a squirrel on the sidewalk, and how many people you might bump into at a grocery store. According to the latest rankings, the most densely packed states are tiny powerhouses like New Jersey and Rhode Island, while the sprawling expanses of Wyoming and Alaska sit at the bottom of the list. This quirky mix of micro‑states and mega‑states makes for a fascinating snapshot of American life, from packed commuter trains in the Northeast to the open road adventures in the West.
Population Density Rankings Explained
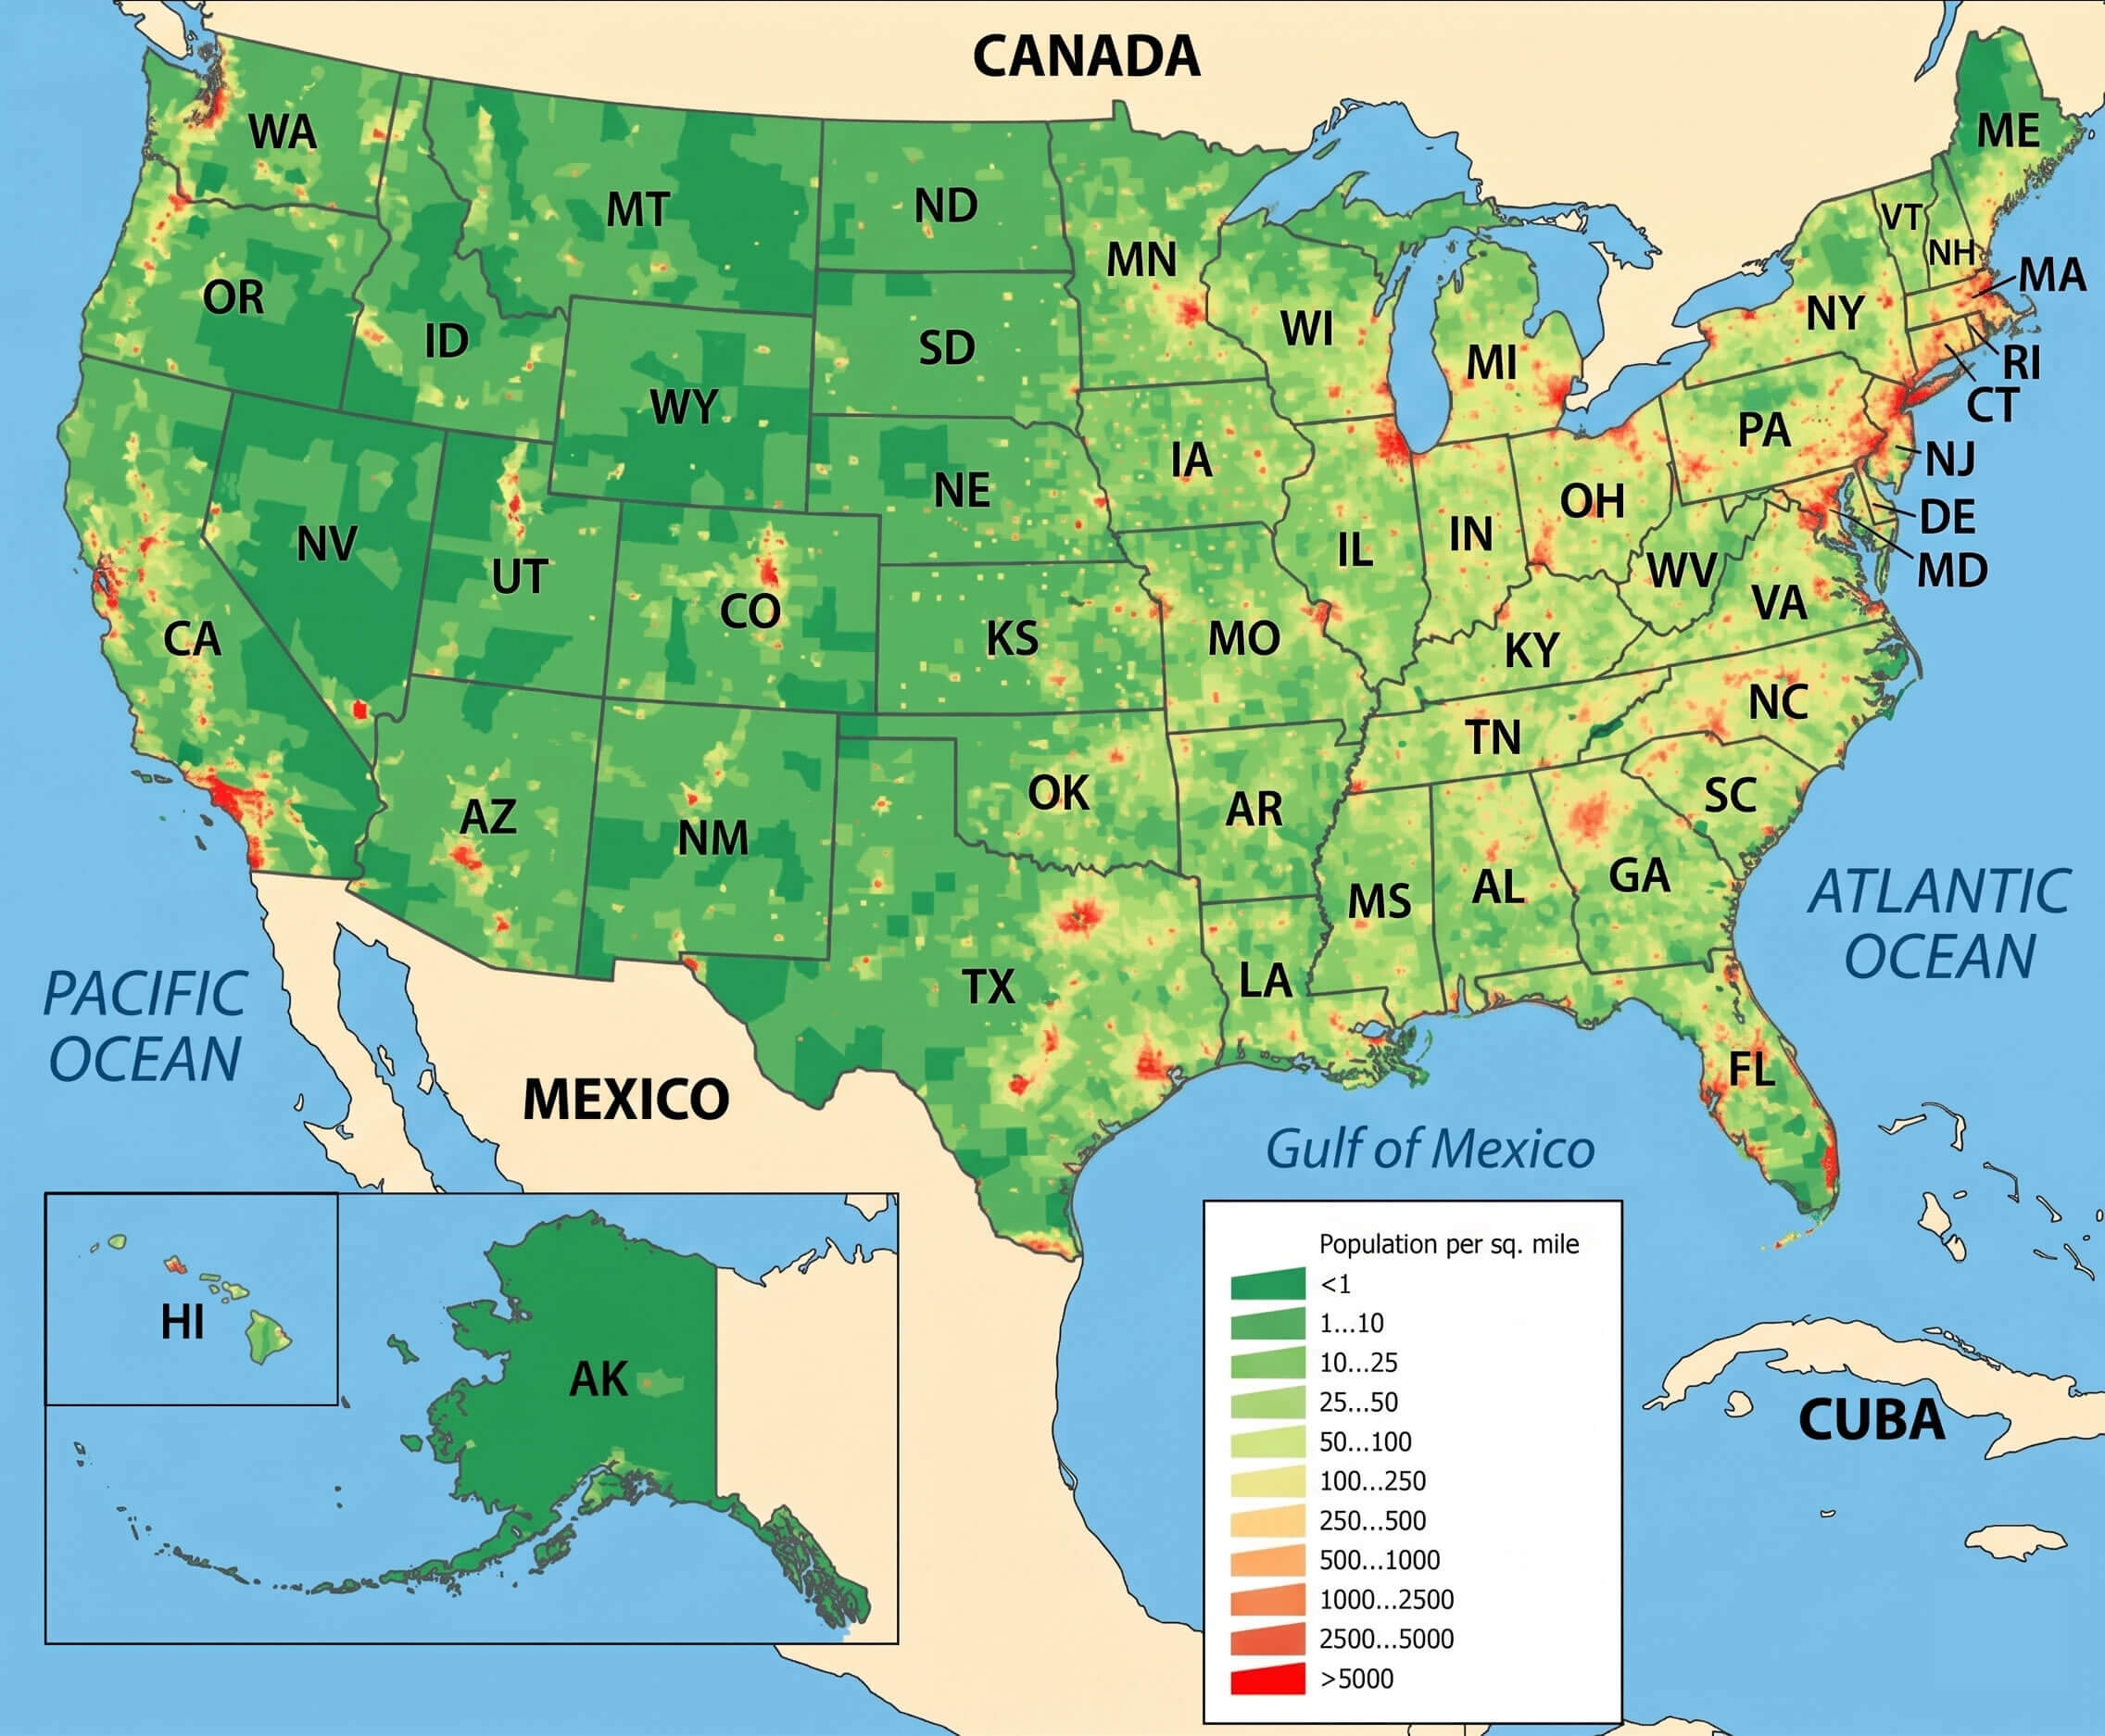
The rankings are calculated by dividing each state’s total population by its land area in square miles. New Jersey tops the chart with roughly 1,200 people per square mile, thanks to its dense urban centers and efficient transit systems. Rhode Island follows closely, while states like California and Florida also boast high numbers due to their large cities and popular tourist spots. In stark contrast, Wyoming and Alaska have fewer than 10 residents per square mile, reflecting their vast wilderness and sparse settlements. These figures help policymakers and businesses predict everything from infrastructure needs to market potential.
What Makes a State Dense?
Population density is influenced by a handful of factors: urbanization, economic opportunities, geography, and even climate. States with thriving tech hubs, bustling financial districts, or iconic cultural landmarks naturally attract more people. Meanwhile, states with harsh climates, rugged terrains, or limited job prospects tend to have lower densities. Transportation infrastructure also plays a role; a well‑connected public transit system can cram more people into a smaller footprint without turning the entire state into a traffic jam.
Implications for Daily Life
High density often means shorter commutes, more public transportation options, and a vibrant social scene, but it also brings challenges like traffic congestion, higher housing prices, and increased noise levels. Low density states offer spacious living, quieter streets, and ample natural beauty, but residents may face longer travel times for shopping or medical care. Businesses use density data to decide where to open new stores, how many employees to hire in a region, and which markets are ready for expansion. For residents, understanding density can help make smarter choices about where to live, how to commute, and what lifestyle to expect.
Population Density Of The USA. By U/JudeMakesMaps - Maps On The Web

Population Density of the USA. by u/JudeMakesMaps - Maps on the Web
Us Map Population Density Capturing The Size And Density Of New York

Us Map Population Density Capturing The Size And Density Of New York
US Population Density Map - Guide Of The World
US Population Density Map - Guide of the World
United States Population Density Map

United States Population Density Map
North America Density US Population Map Guide Of The World
North America Density US Population Map Guide Of The World
Us Map Population Density
Us Map Population Density
United States Population Map What Does The US Population Density Looks

United States Population Map What Does The US Population Density Looks
US Population Density Map - Guide Of The World
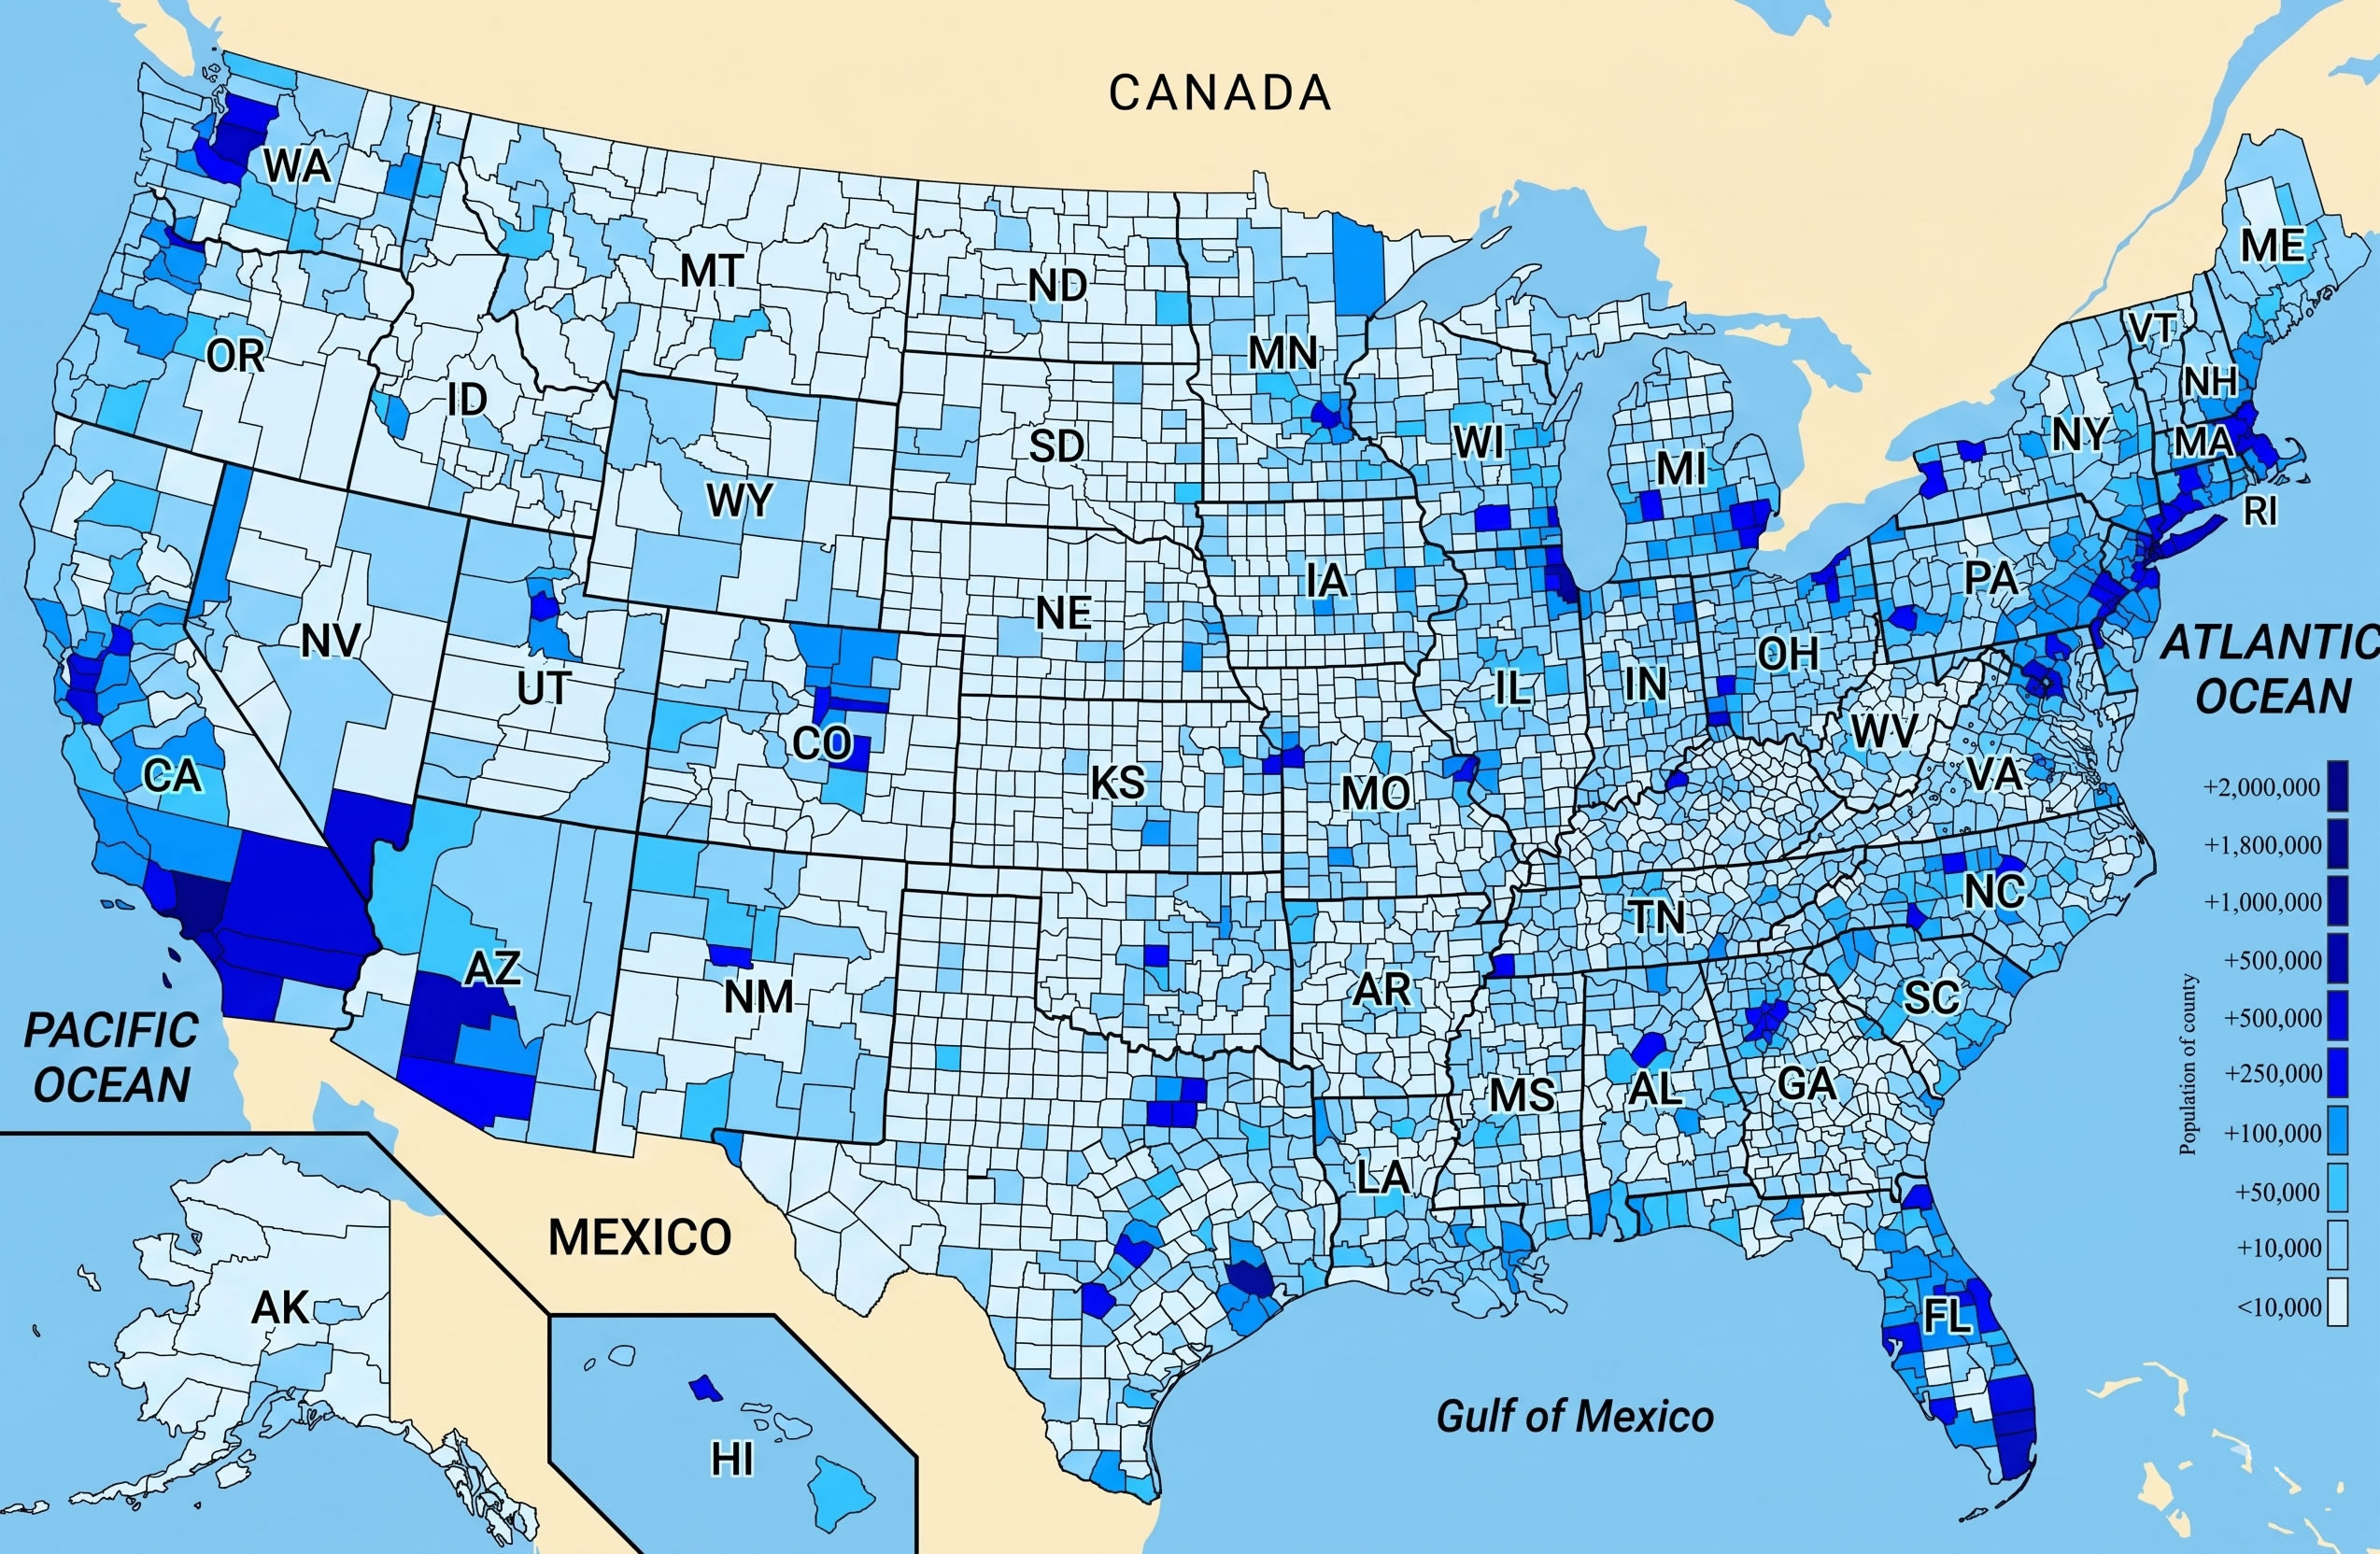
US Population Density Map - Guide of the World
U.S. Population Density Map | Map, United States Map, Human Geography

U.S. Population Density Map | Map, United states map, Human geography
Population Size And Density Chart – OVNI

Population Size And Density Chart – OVNI
US Cities By Population Density Of Urban Area -- Stocking Blue
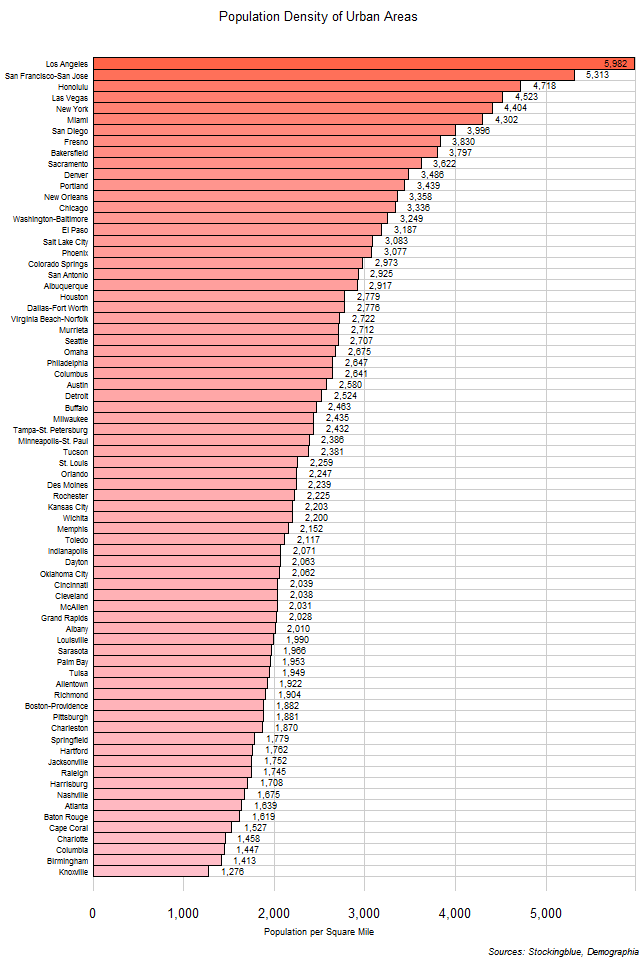
US Cities by Population Density of Urban Area -- Stocking Blue
Population Density Map Of USA 2025

Population Density Map of USA 2025
Population Density By State
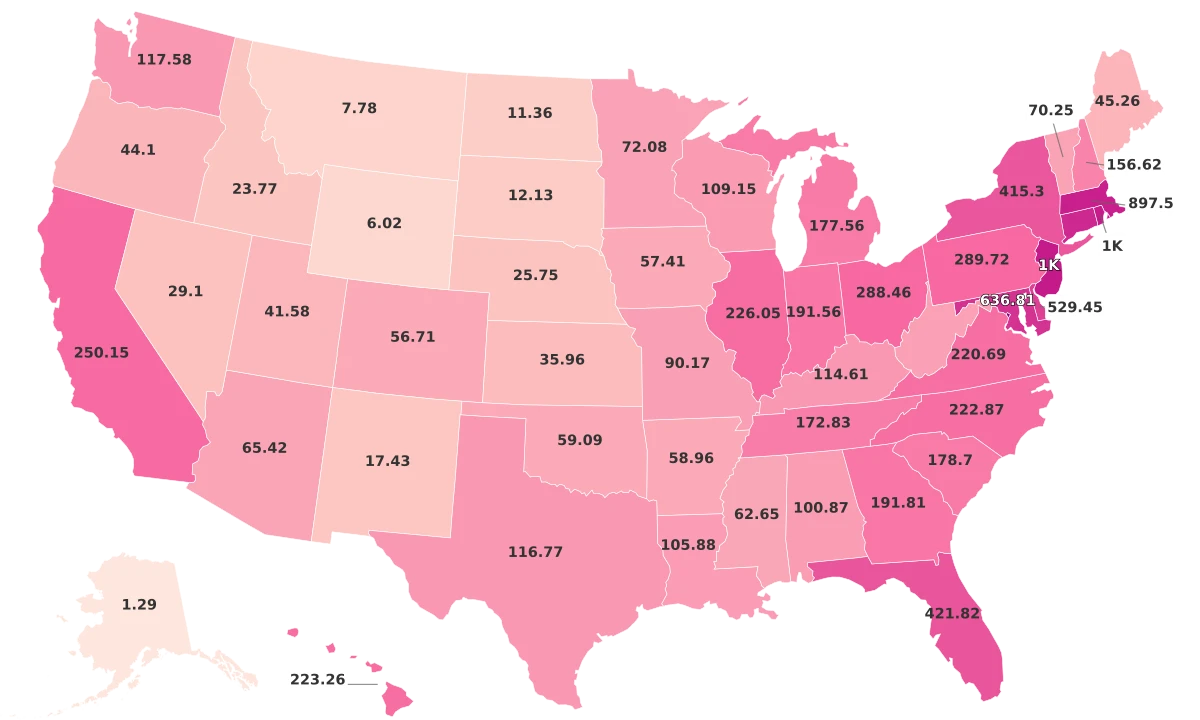
Population Density By State
Top 10 States | Highest Population Density | 2023 | Zip Atlas

Top 10 States | Highest Population Density | 2023 | Zip Atlas
Ranking Of States By Population – CPUS

Ranking Of States By Population – CPUS
Population Density By State 2024

Population Density By State 2024
United States Population Density Map
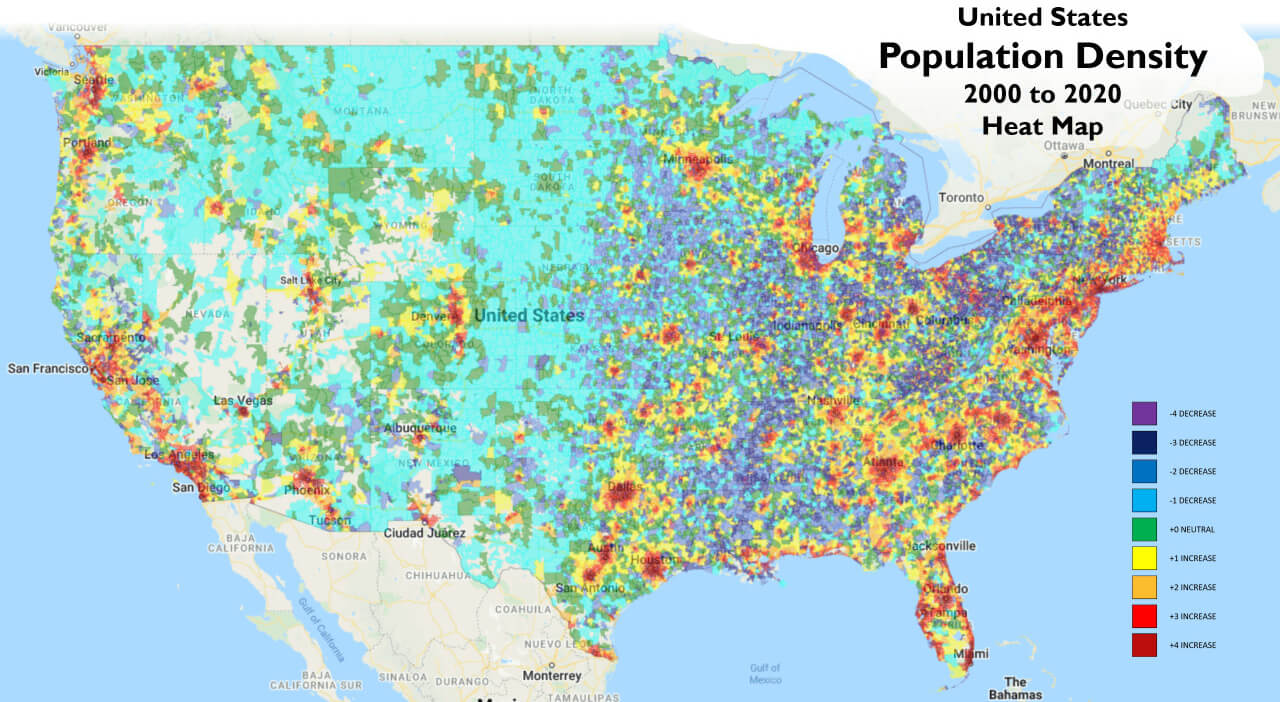
United States Population Density Map
States Ranked By Population Density – GCDJ

States Ranked By Population Density – GCDJ
US States By Population Density -- Stocking Blue
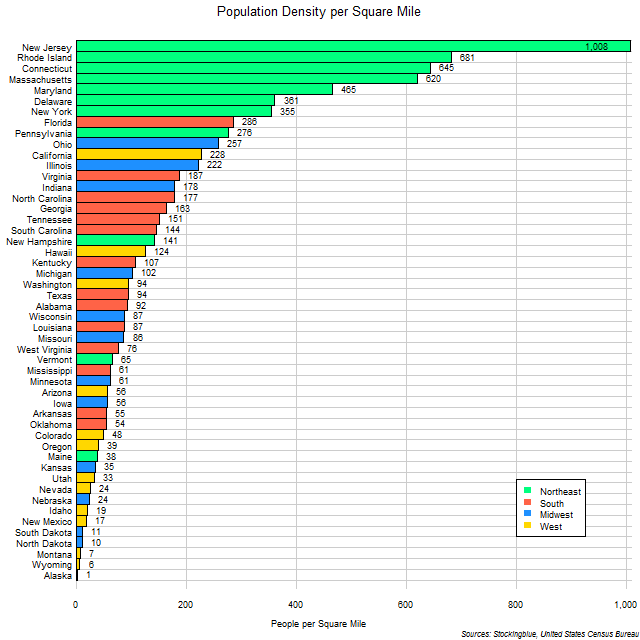
US States by Population Density -- Stocking Blue
States Ranked By Population Density – GCDJ

States Ranked By Population Density – GCDJ
Map Of United States Population Density — Gridgrab

map of united states population density — Gridgrab
Us Population Density Heat Map – XFPU

Us Population Density Heat Map – XFPU
US States Ranked By Population Density [946 X 550] : R/MapPorn

US States Ranked by Population Density [946 x 550] : r/MapPorn
[Oc] Us Counties By Population Density _ Ranking Of Counties By

[Oc] Us Counties By Population Density _ Ranking Of Counties By ...
Plot Us Population Density On Map Python - Propmens
Plot us population density on map python - propmens
US Population Density Map
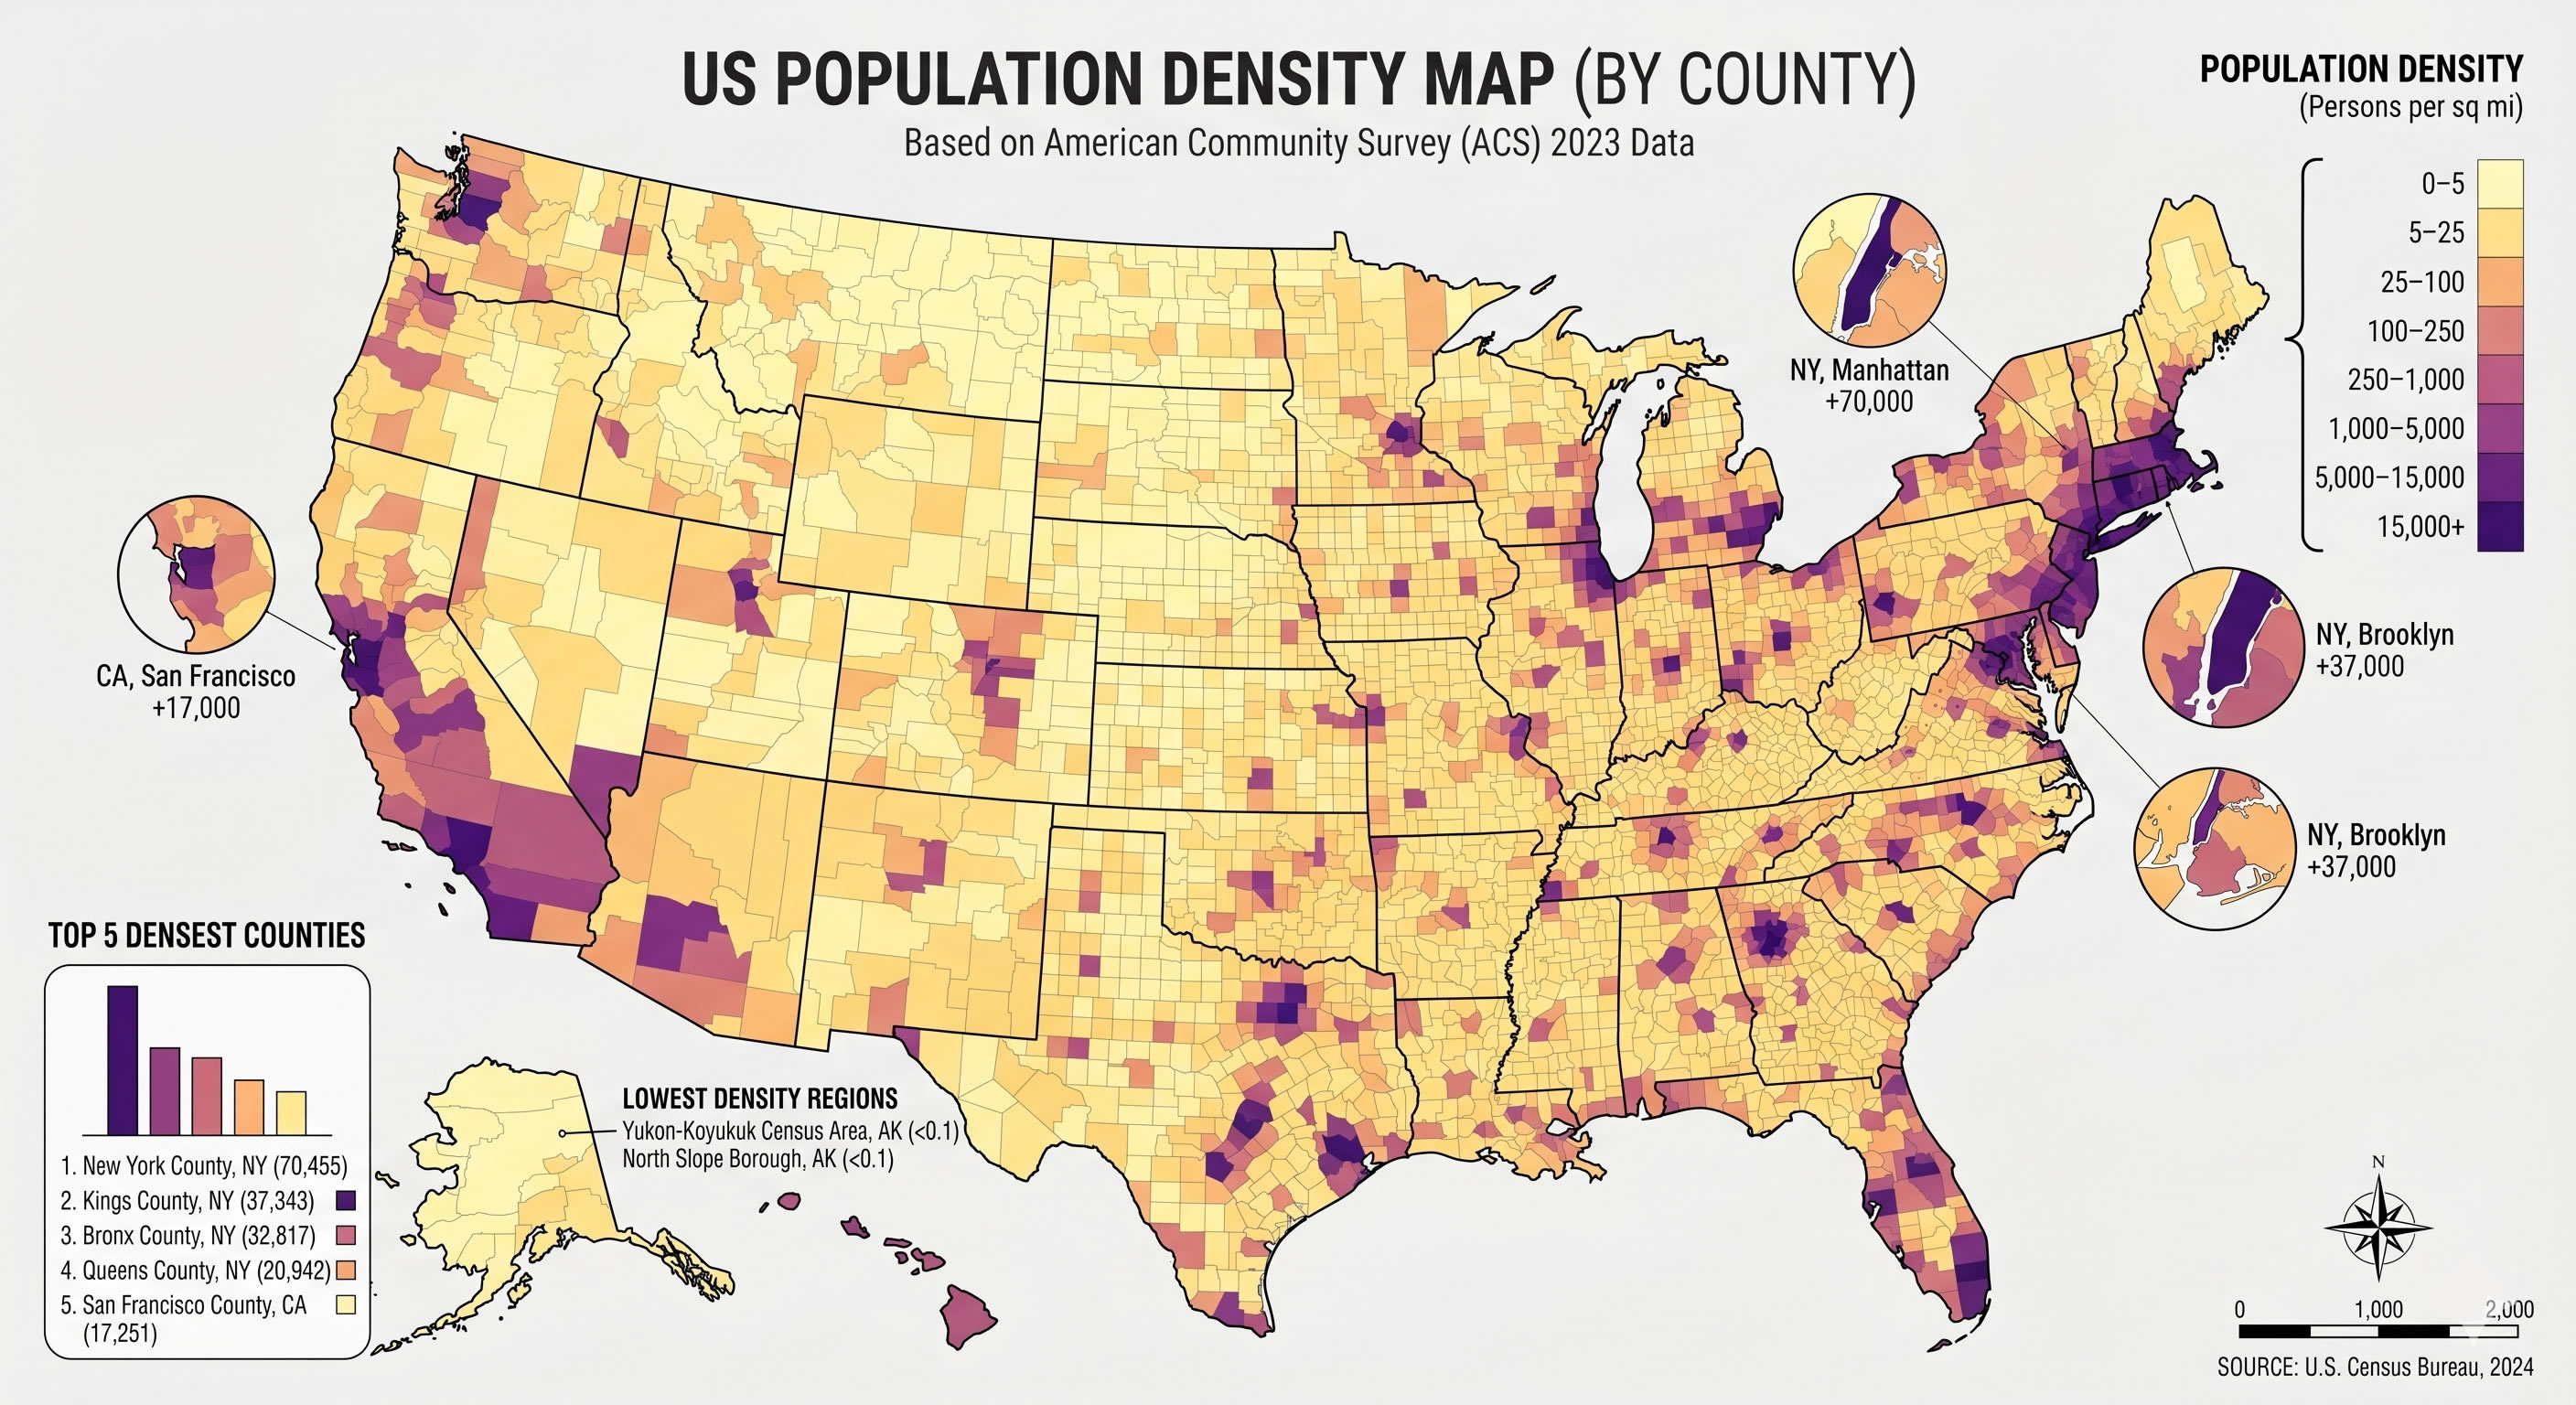
US Population Density Map
Population Density In The U.S., By State 2023| Statista
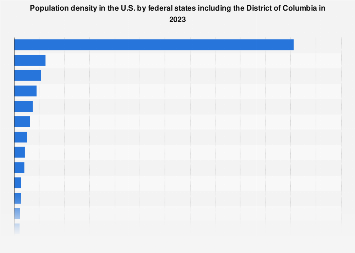
Population density in the U.S., by state 2023| Statista
