New US Population Density Dataset Reveals Urban Concentration Trends
In a breakthrough for demographic analysis, a newly released dataset provides a granular view of population density across the United States. Covering every census tract, the data offers insights into where people live, how urban centers grow, and where resources may be most needed. Researchers, planners, and policymakers can now tap into a more precise picture of America’s human geography, helping guide infrastructure investments, emergency services, and environmental management.
Dataset Overview
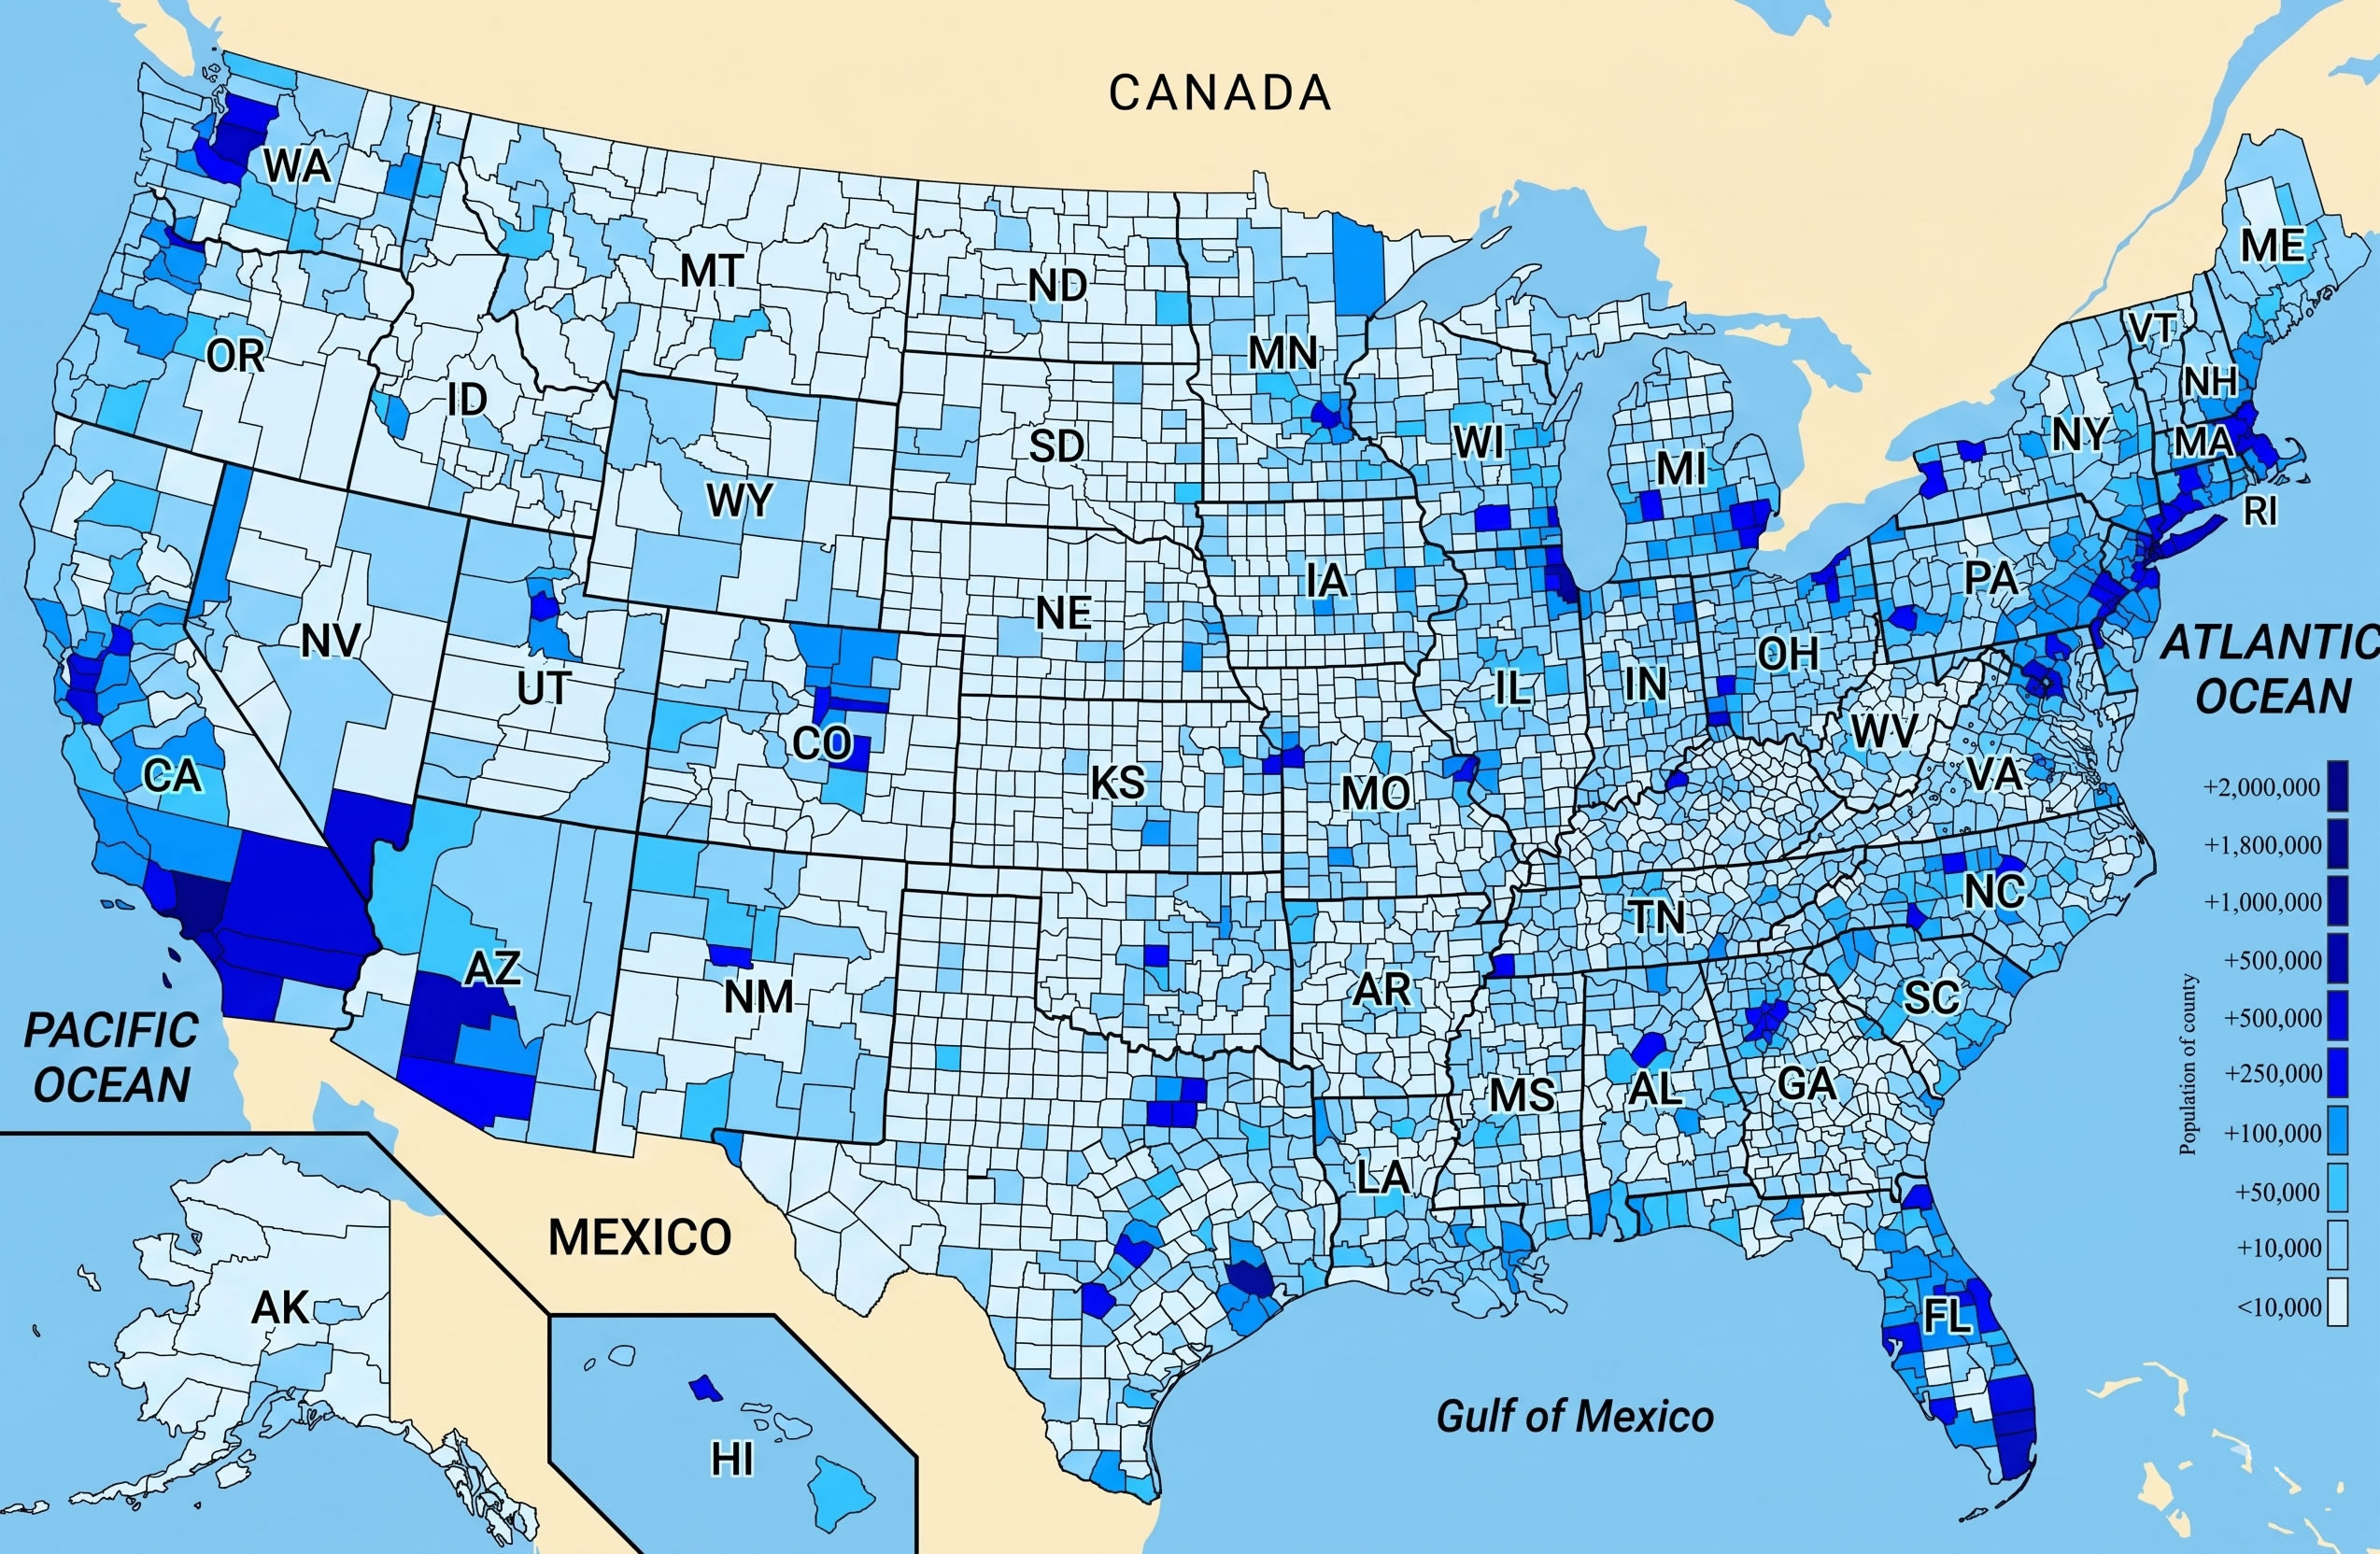
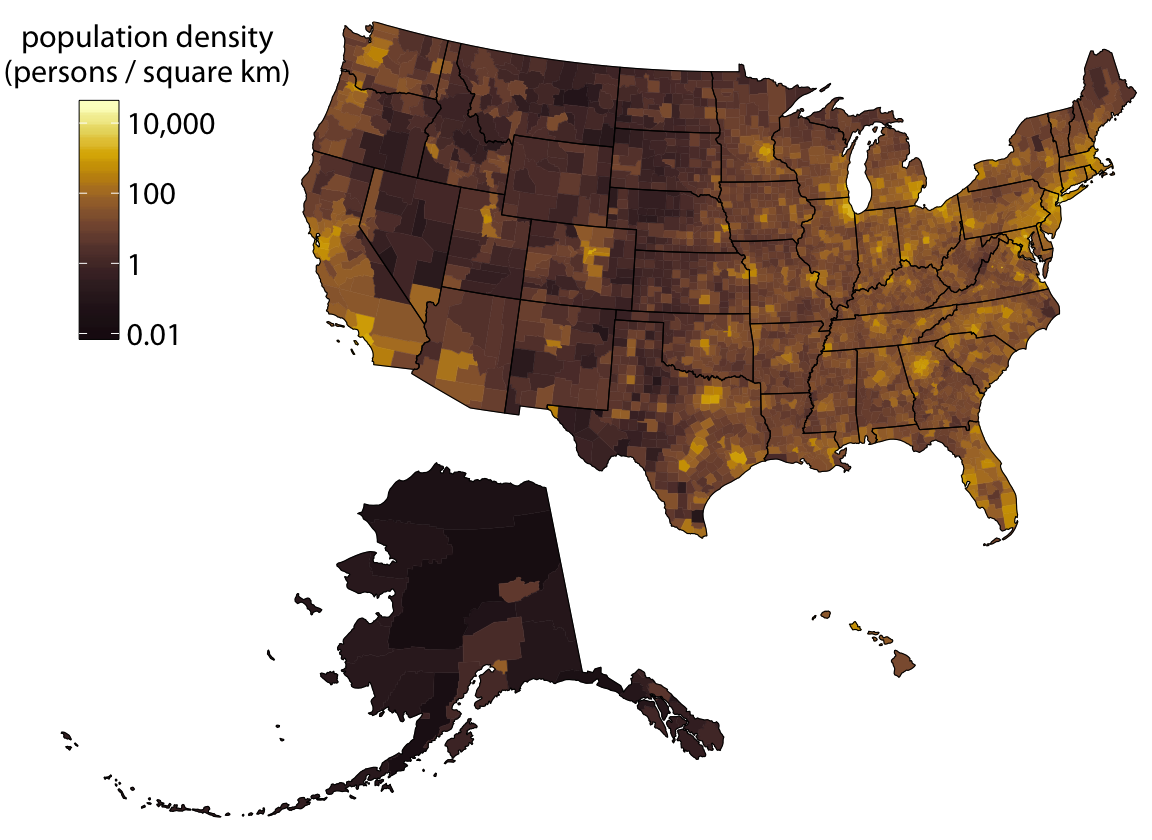
The dataset aggregates the latest census data with geographic boundaries at the tract level, capturing over 71,000 unique units. Each entry records population counts, area measurements, and derived density values expressed in residents per square mile. By aligning this data with GIS shapefiles, analysts can overlay density metrics onto maps for visual storytelling and spatial analysis. The resulting figures reveal stark contrasts: some rural tracts host fewer than 10 residents per square mile, while urban cores like New York City exceed 35,000.

Mapping Techniques
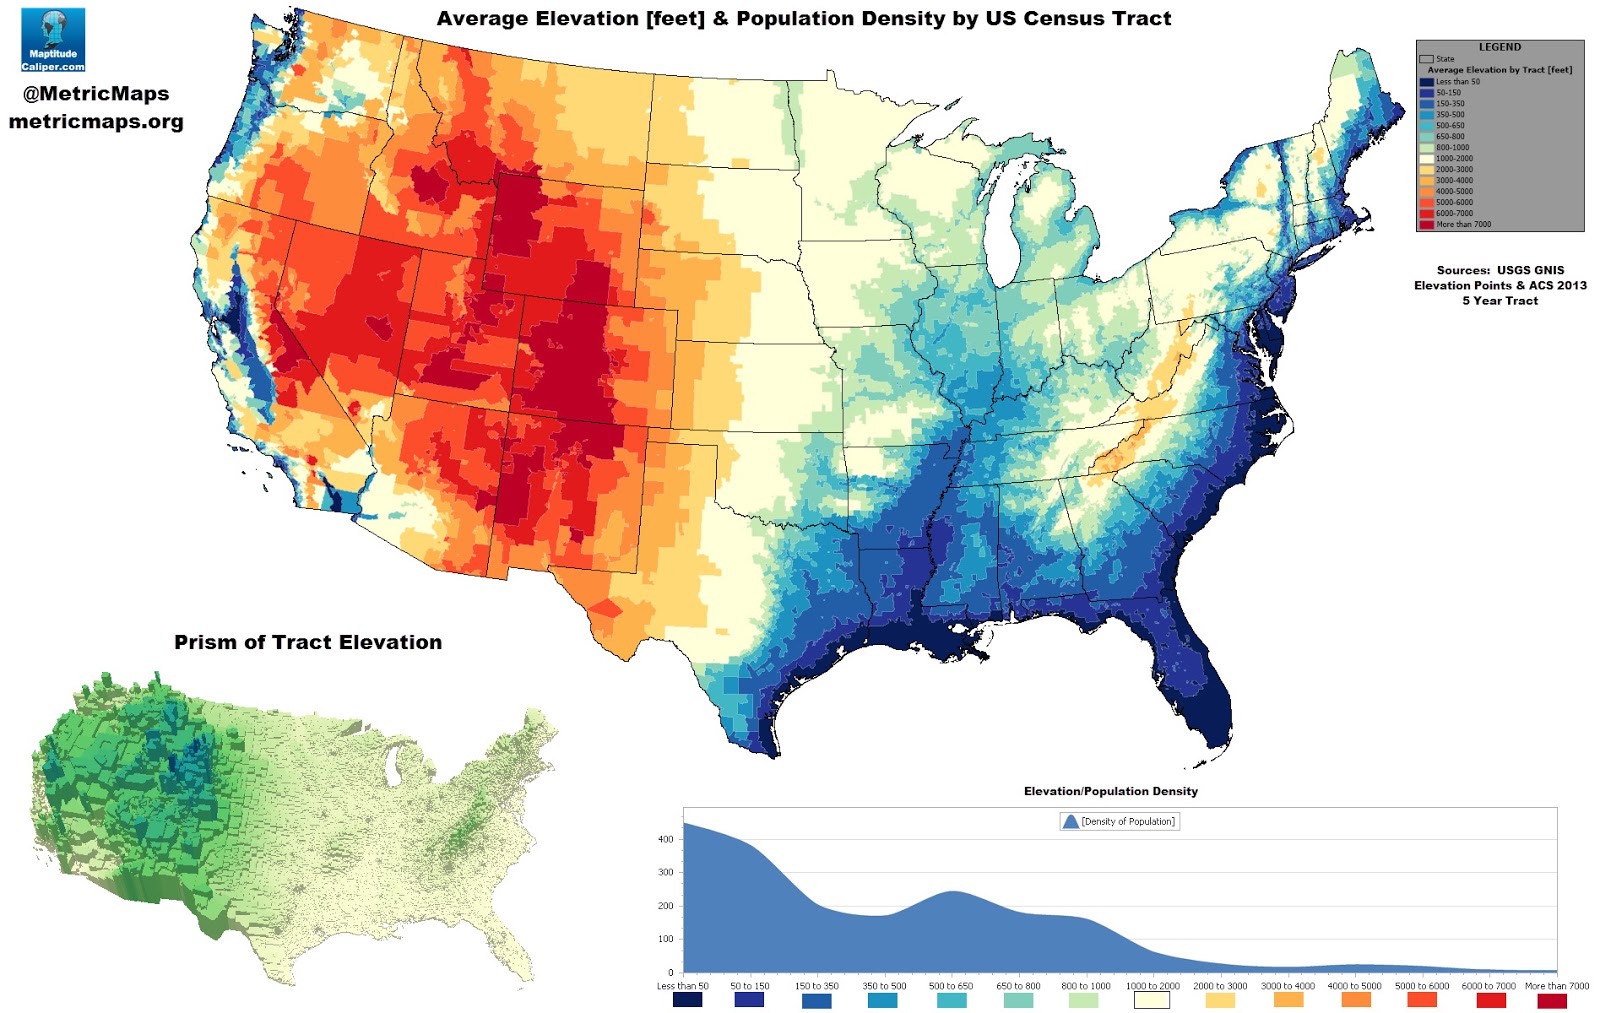
Utilizing Python libraries such as Geopandas, Folium, and Matplotlib, developers can transform raw numbers into heatmaps, choropleths, and interactive dashboards. These tools enable the creation of layered maps where density is shaded from light blue for sparse areas to deep red for highly concentrated populations. The dataset’s fine granularity supports multi-resolution analysis, from national overviews down to city blocks, facilitating targeted policy decisions.
Insights from the Data
Analyses of the dataset highlight persistent trends: coastal corridors and major metropolitan areas remain the densest, whereas interior plains and mountainous regions retain low population densities. However, recent shifts show modest growth in secondary cities like Austin, Nashville, and Charlotte, indicating a gradual decentralization from traditional hubs. Moreover, the data exposes disparities in housing availability, as some high‑density tracts show signs of overcrowding, while others face under‑utilized land.
Implications for Planning
For urban planners, the dataset informs zoning decisions, transit route optimization, and public service distribution. Emergency management agencies can pinpoint high‑risk zones for disasters such as hurricanes or wildfires, ensuring rapid response. Environmental scientists use density overlays to assess human impact on ecosystems, guiding conservation efforts. Lastly, business developers can leverage the information to target market entry strategies, choosing locations with favorable population concentrations.
United States Population Density Map – GeoGebra

United States Population Density Map – GeoGebra
Population Density Us Interactive Map - Mensmanager
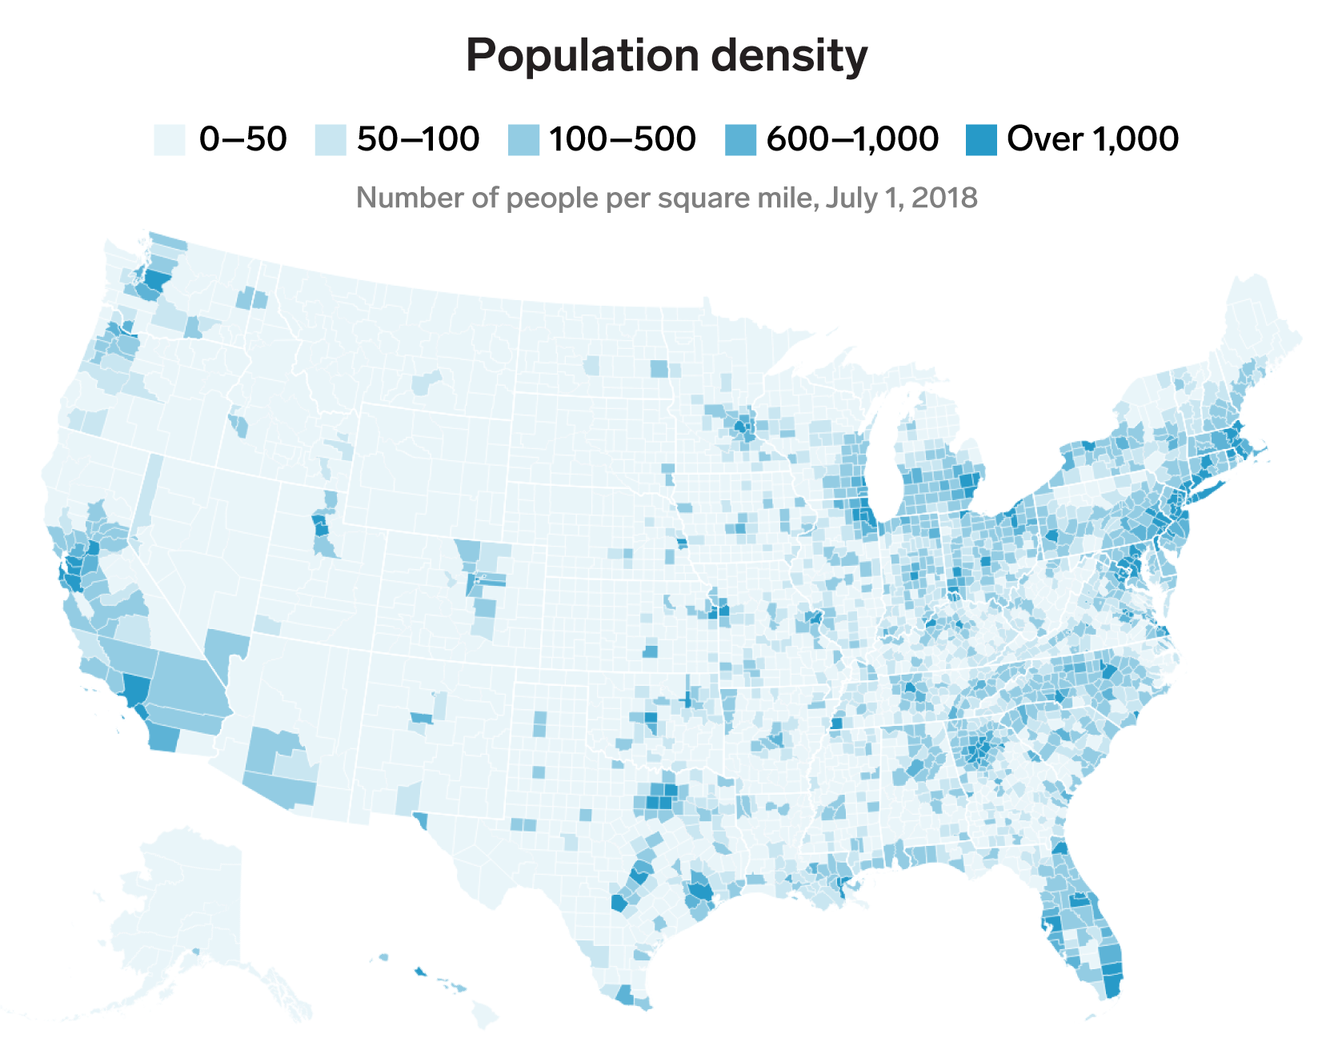
Population density us interactive map - mensmanager
Preview Image Of U.S. Population Density
Preview Image of U.S. Population Density
How To Create A US Population Density Map
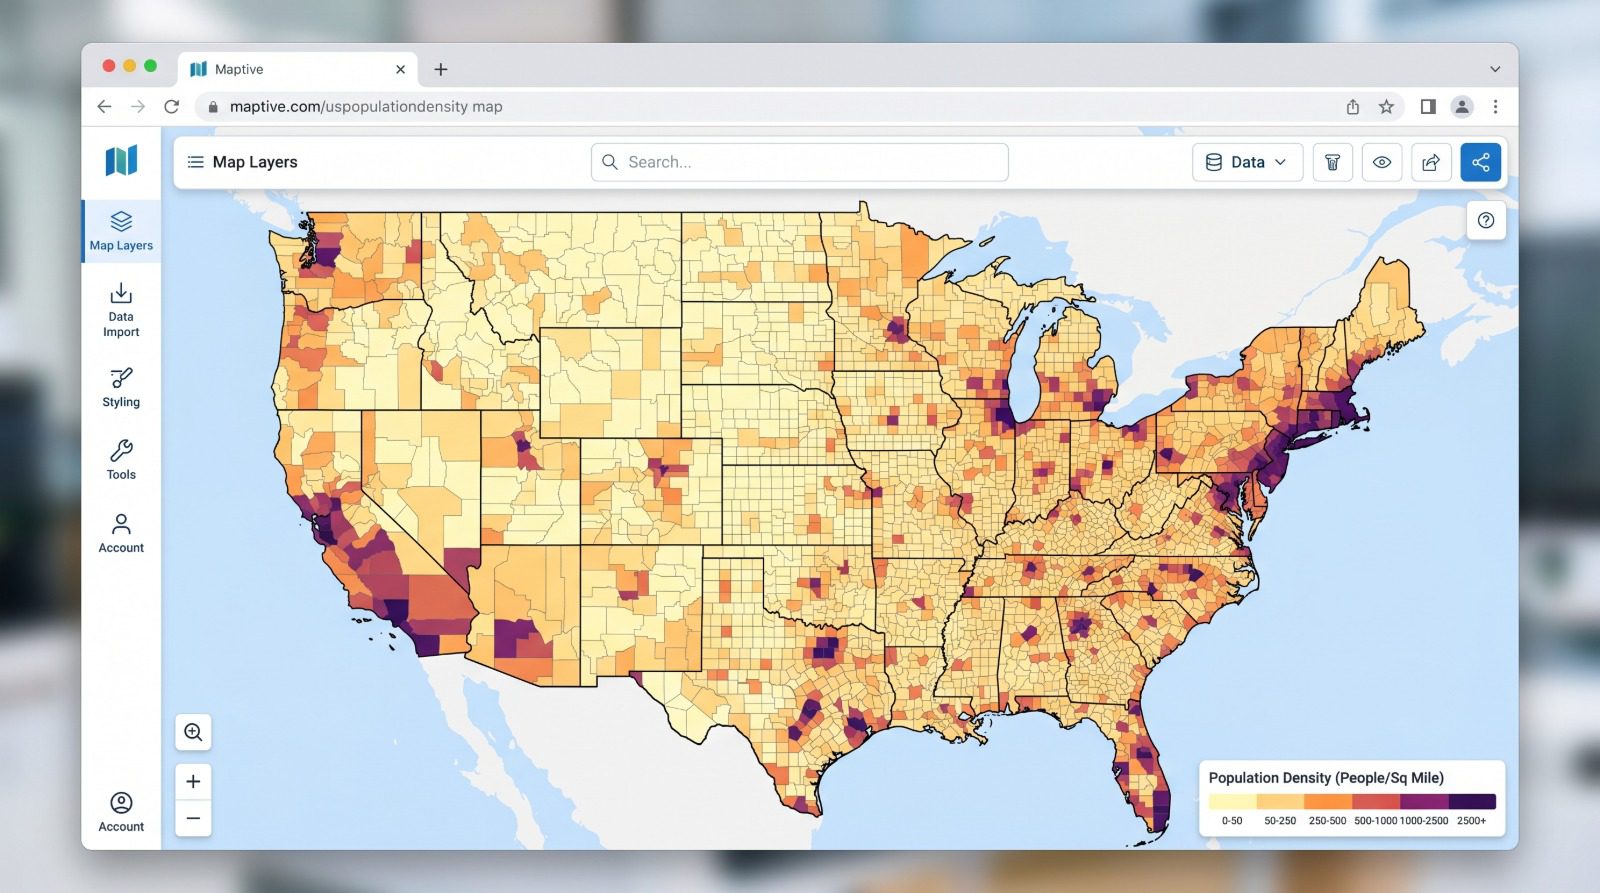
How to Create a US Population Density Map
Map Of United States Population Density — Gridgrab

map of united states population density — Gridgrab
3d Us Population Density Map - Pokhosts
3d us population density map - pokhosts
American Population Density By Longitude En 2024

American population density by longitude en 2024
Population Density Map Of USA 2025

Population Density Map of USA 2025
Population Density Map US United States Population Density Map
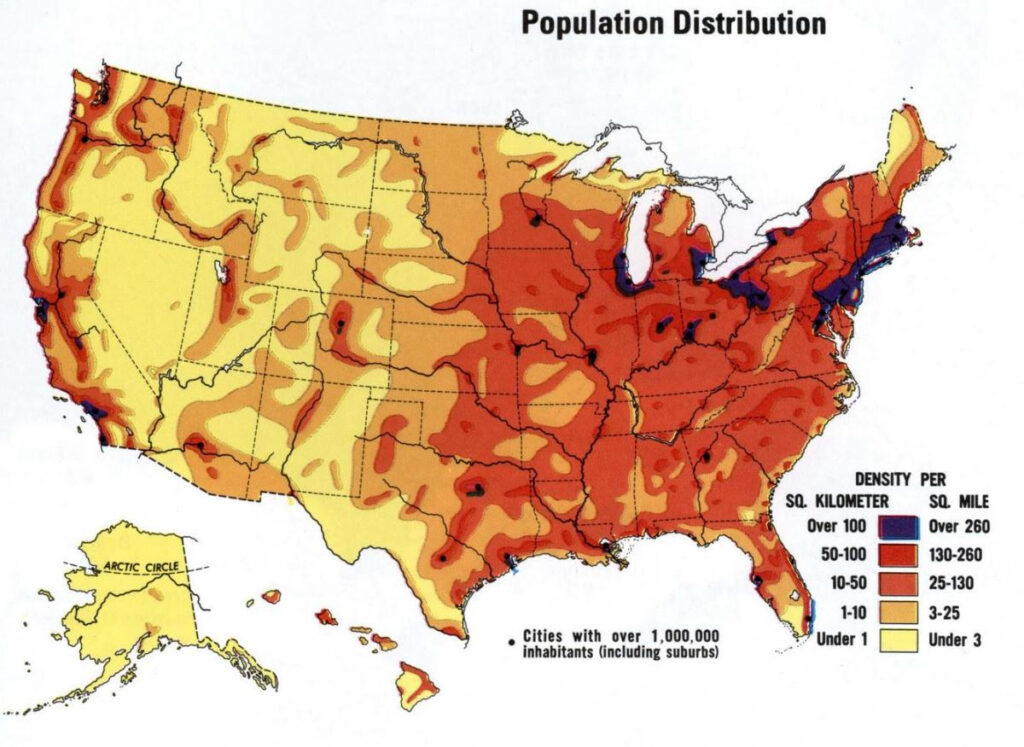
Population Density Map US United States Population Density Map ...
Population Density, 2020

Population Density, 2020
Atlanta Population Density Map 2000 Census And FHWA Adjusted Urbanised

Atlanta Population Density Map 2000 Census And FHWA Adjusted Urbanised
United States Population Density Map

United States Population Density Map
United States Population Density Map
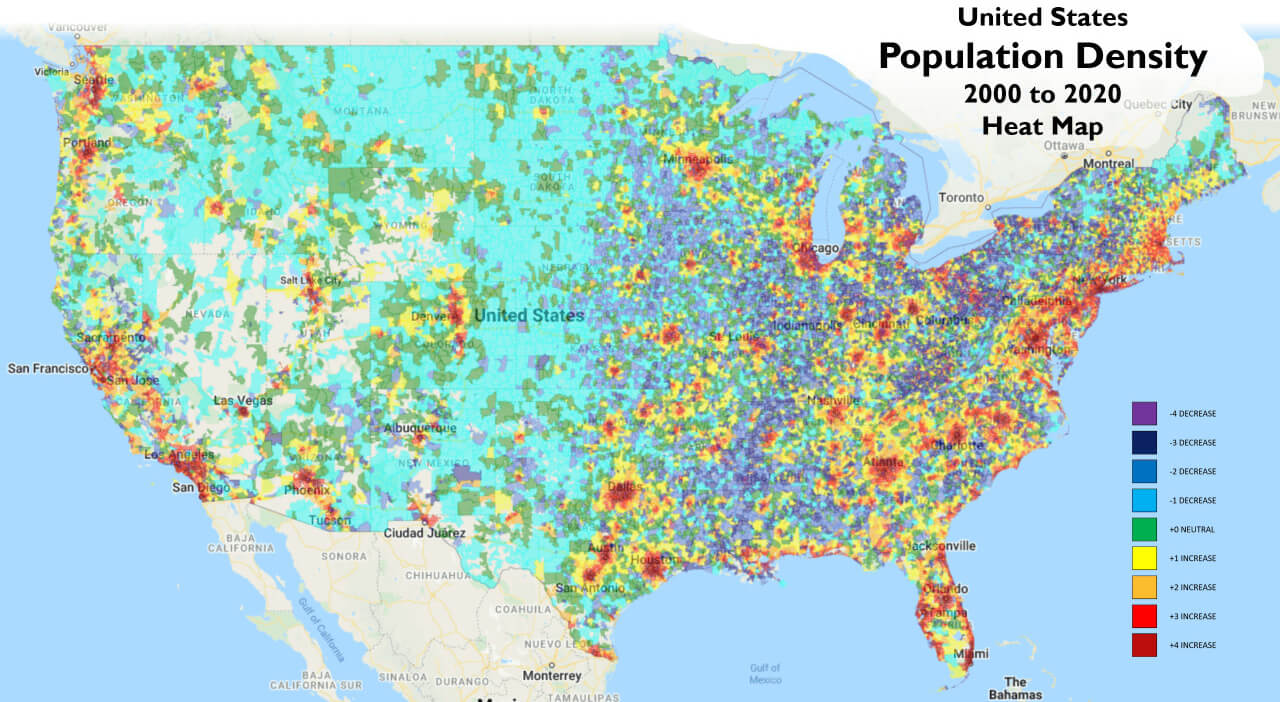
United States Population Density Map
United States And New York City Population Density Map
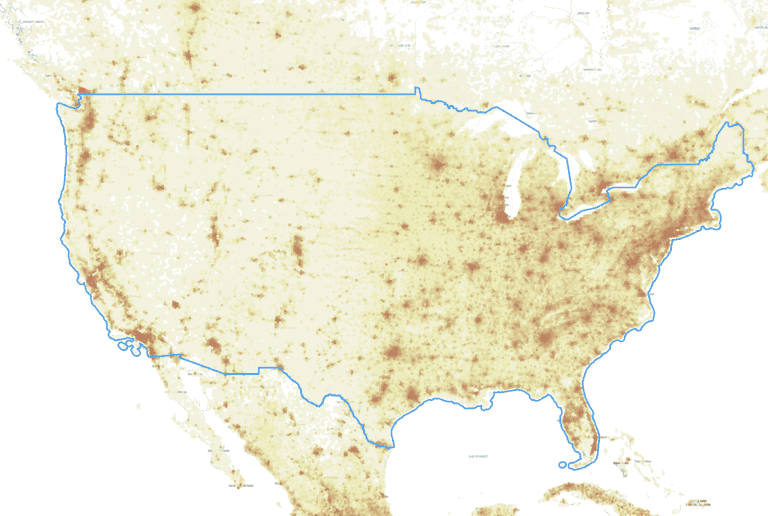
United States and New York City Population Density Map
U.S. Population Density Mapped - Vivid Maps | Population Density Map

U.S. Population Density Mapped - Vivid Maps | Population density map ...
Population Density Us Interactive Map - Assefolio

Population density us interactive map - assefolio
Us Population Density Heat Map – XFPU

Us Population Density Heat Map – XFPU
North America Density US Population Map Guide Of The World
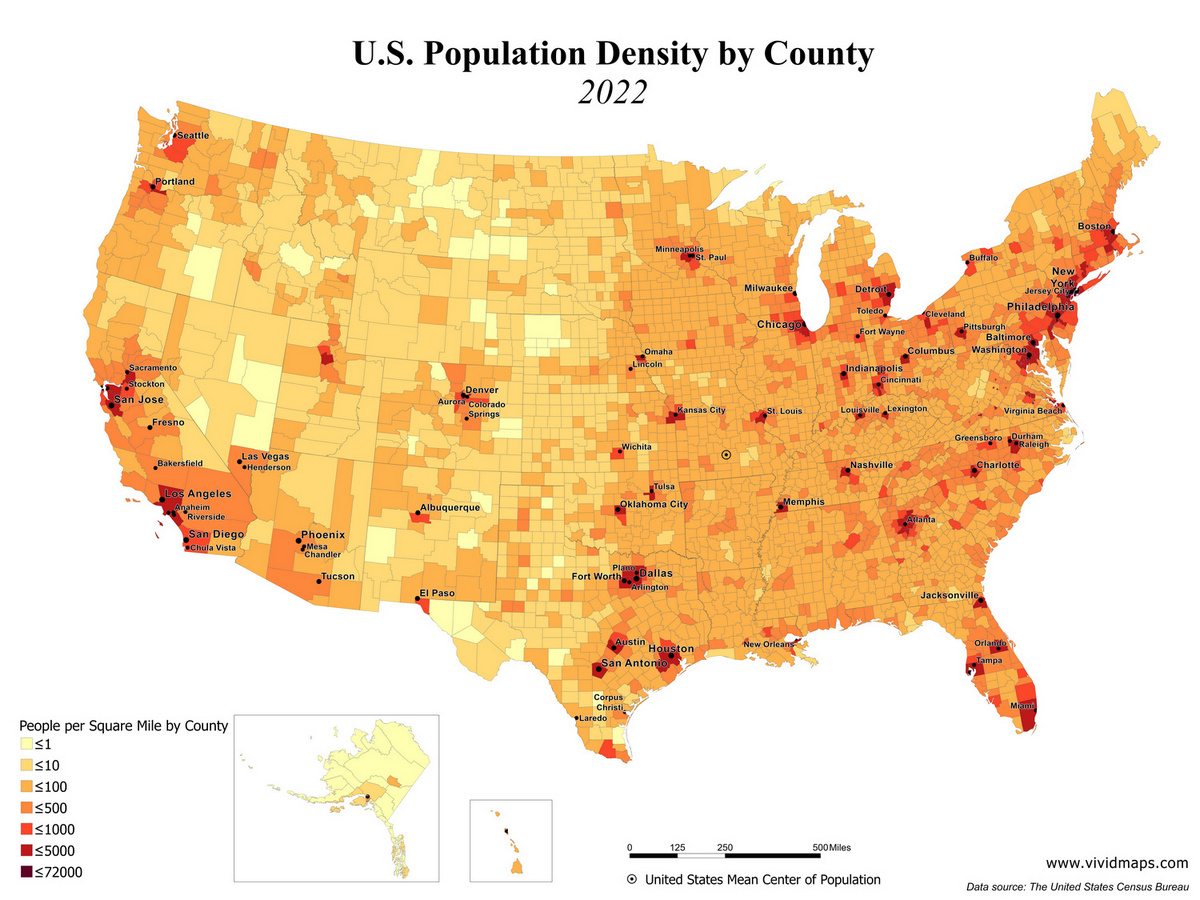
North America Density US Population Map Guide Of The World
U.S. Population Density Map | Map, United States Map, Human Geography

U.S. Population Density Map | Map, United states map, Human geography
Population Density Map Of US

Population Density Map of US
Population Density Of US States (inc. DC) By Mi²,... - Maps On The Web

Population Density of US States (inc. DC) by mi²,... - Maps on the Web
United States Population Density Map

United States Population Density Map
US Population Density Map - Guide Of The World
US Population Density Map - Guide of the World
United States Population Density - NASA Science

United States Population Density - NASA Science
Us Population Density Wall Map Thematic - Mensbody
Us population density wall map thematic - mensbody
Us Population Density High Res Map - Hourress

Us population density high res map - hourress
Plot Us Population Density On Map Python - Propmens
Plot us population density on map python - propmens
Map Showing Population Density Usa – GMCRXG

Map Showing Population Density Usa – GMCRXG
U.S. Map Of Population Density : R/dataisbeautiful

U.S. Map of Population Density : r/dataisbeautiful
📊 US Population Density Visualization

📊 US Population Density Visualization
