Population Maps: Visualizing the World's Human Footprint — Insights and Implications
Population maps translate raw census data into a visual story about where people live, how densely they cluster, and how those patterns shift over time. These graphics help governments, businesses, and communities plan resources, predict growth, and address challenges such as overcrowding and resource scarcity. In an era of rapid urbanization—especially across Asia where cities like Shanghai, Jakarta, and Mumbai are expanding at record rates—population maps have become indispensable tools for strategic decision‑making.
Understanding Population Maps
At its core, a population map is a spatial representation that assigns a color or shade to each geographic area based on the number of inhabitants per unit of land. The scale—whether it shows entire countries or individual districts—determines the granularity of insights. For policymakers, the map’s visual cues highlight hotspots of density, enabling targeted infrastructure investments such as transit lines or hospitals.

Key Features of Population Density Visualizations
Modern population density maps employ gradient color schemes, with lighter tones indicating sparse populations and darker hues representing crowded areas. Interactive layers allow users to toggle between raw population counts, density per square kilometer, and demographic breakdowns by age or income. In many Asian regions, these maps reveal a striking contrast: high-density megacities adjacent to vast rural landscapes still awaiting development.

Implications for Urban Planning and Policy
Urban planners use population maps to forecast demand for housing, transportation, and public services. In countries like China and India, the maps guide the expansion of high‑capacity rail networks and the siting of new satellite towns to ease congestion in core metros. Additionally, emergency response teams rely on density data to prioritize evacuation routes and resource allocation during natural disasters, which are increasingly common in densely populated coastal zones.
Future Trends in Population Mapping
Advances in satellite imagery and AI-driven data processing are making population maps more accurate and real‑time than ever before. Emerging techniques like nighttime light analysis and mobile phone data triangulation provide near‑instant updates on shifts in human activity. For Asian cities grappling with rapid migration, these tools offer a dynamic view of settlement patterns, enabling proactive governance and sustainable growth strategies.
In summary, population maps convert complex demographic statistics into accessible visuals that inform policy, business strategy, and societal awareness. As Asia continues to urbanize, these maps will remain a critical asset for navigating the challenges and opportunities of a densely connected world.
World Map By Population Density At Daniel Shears Blog
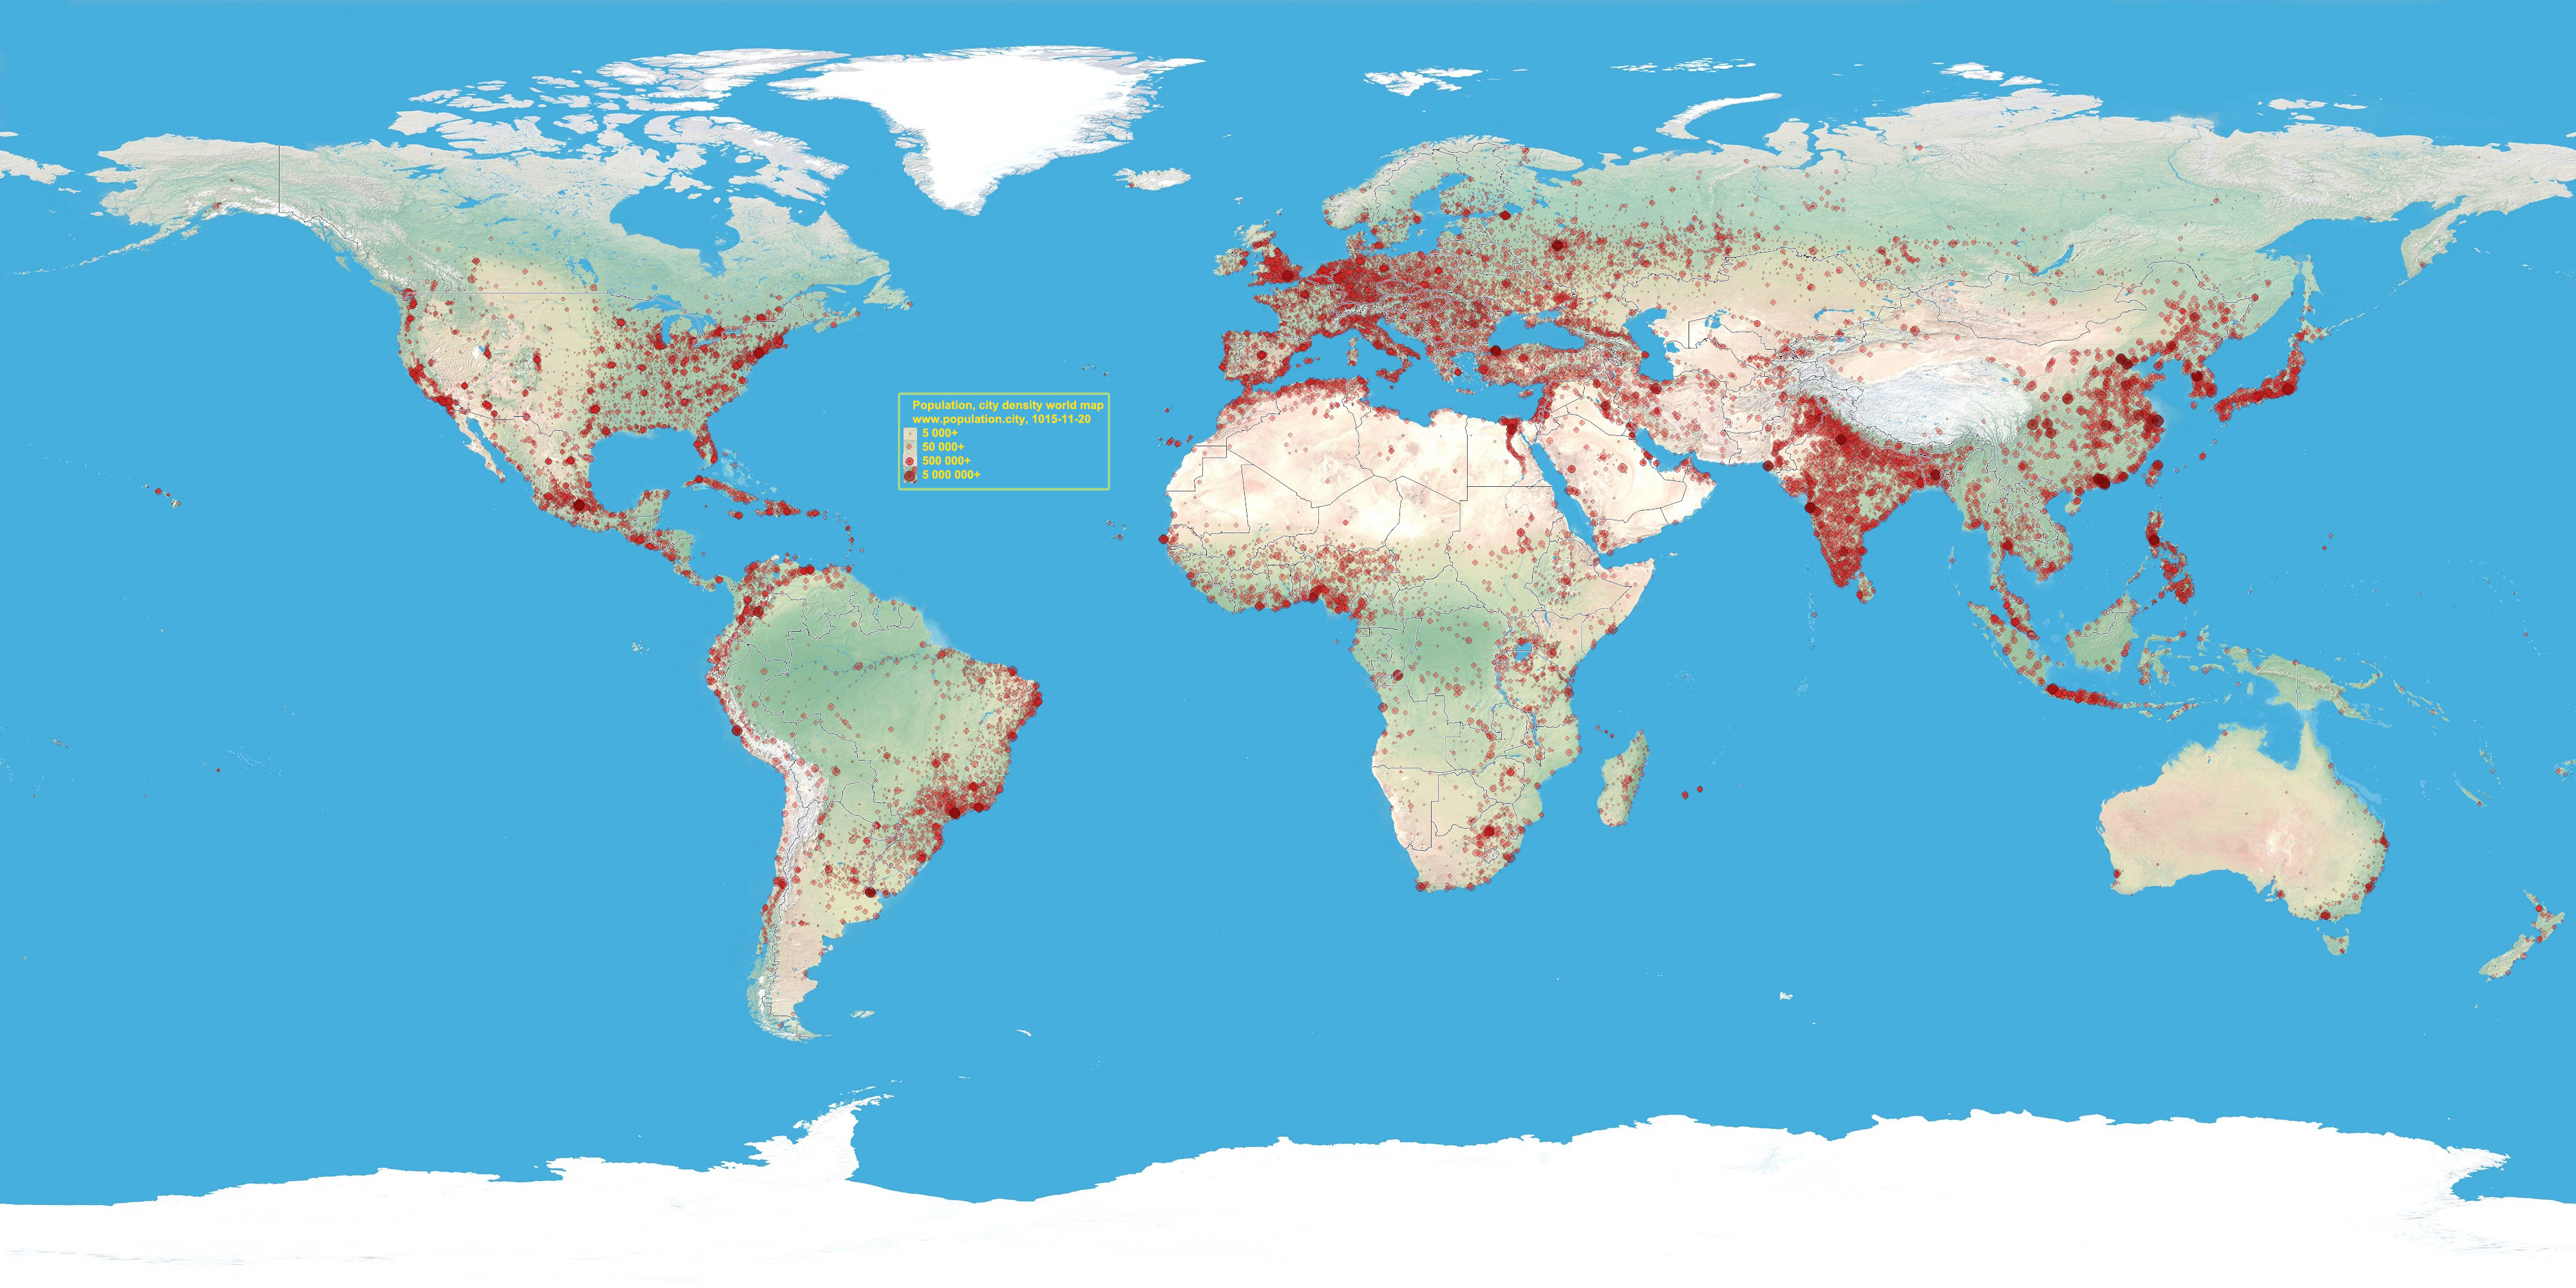
World Map By Population Density at Daniel Shears blog
World Population Density Interactive Map 1200x624

World Population Density Interactive Map 1200x624
United States Population Density Map
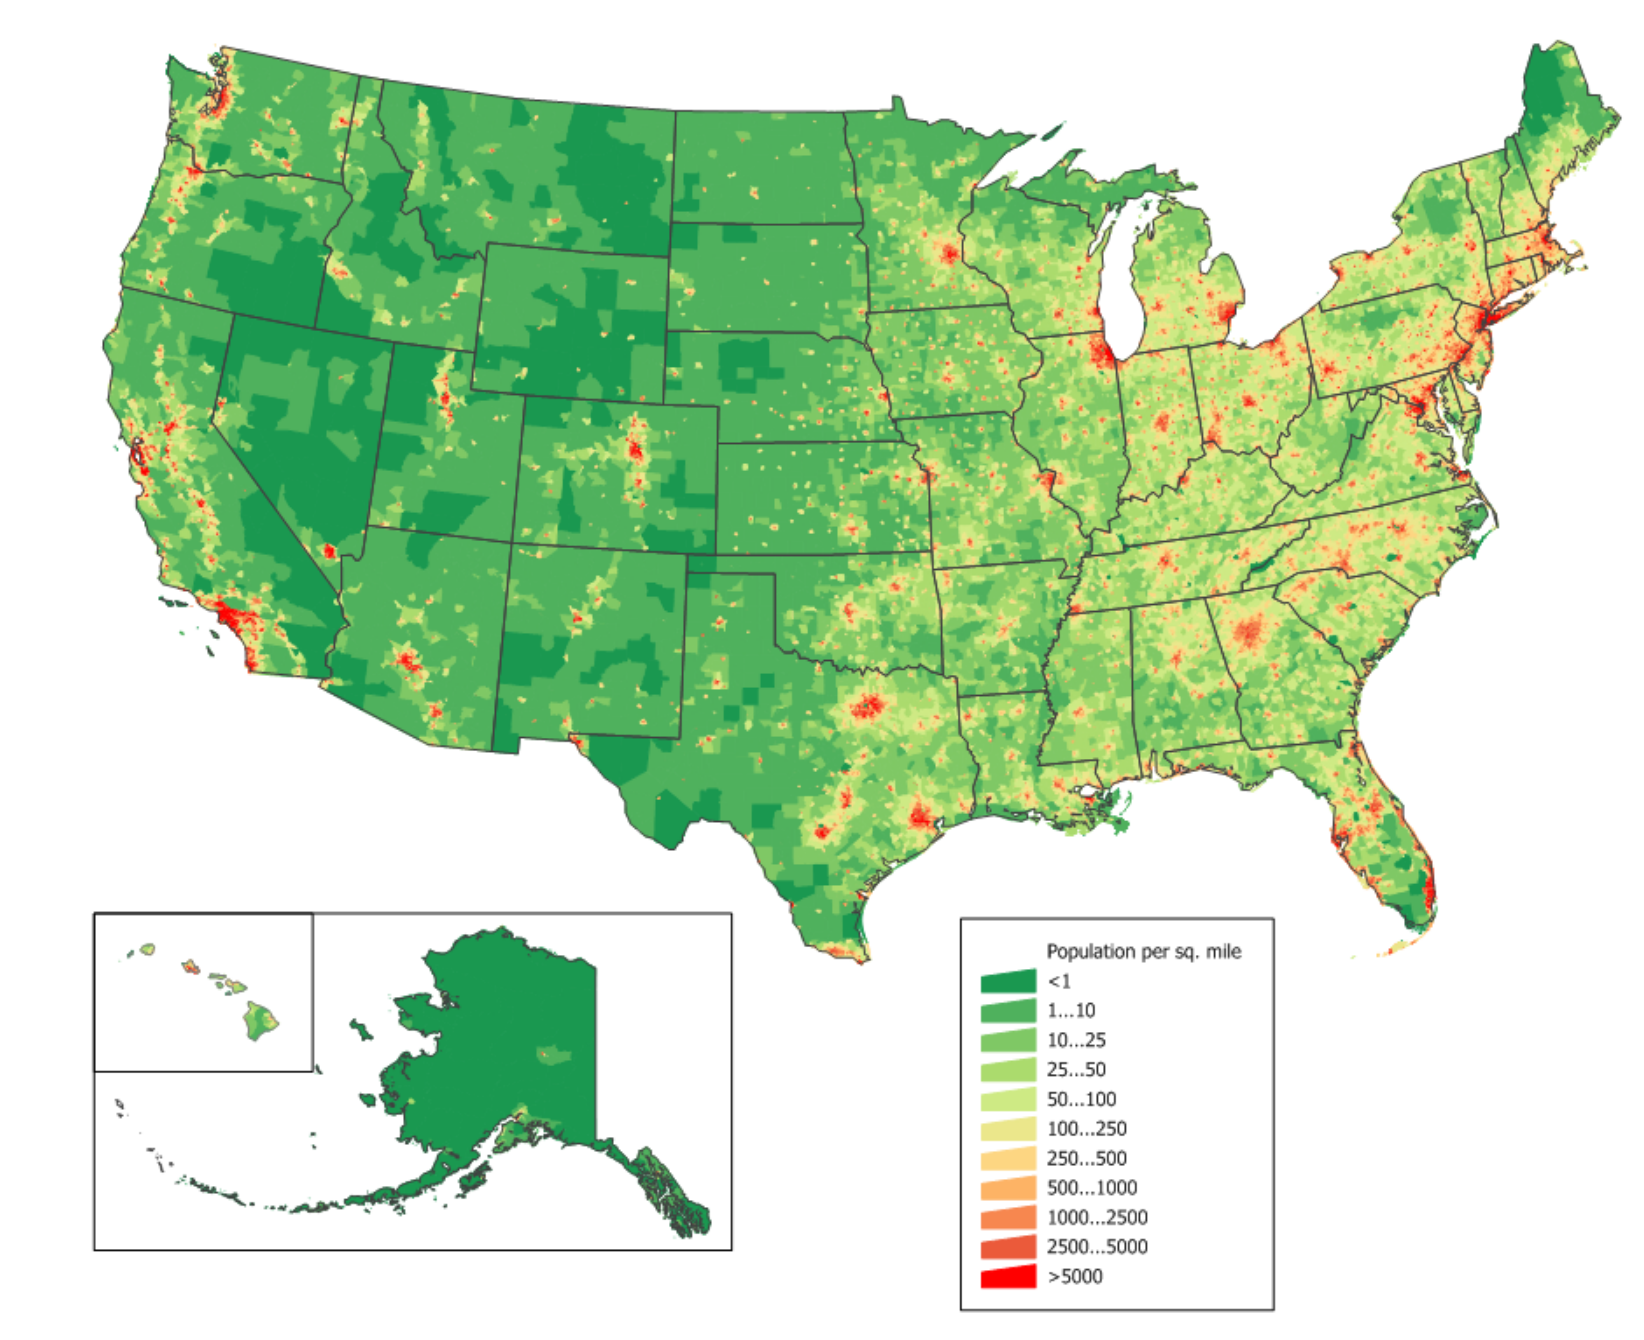
United States Population Density Map
3d Us Population Density Map - Pokhosts
3d us population density map - pokhosts
United States Population Density Map - All For One

United States Population Density Map - All For One
World Map By Population Density At Daniel Shears Blog

World Map By Population Density at Daniel Shears blog
File:World Population Density Map 2020.png - Wikimedia Commons

File:World Population Density Map 2020.png - Wikimedia Commons
World Population Density Interactive Map 1200x624

World Population Density Interactive Map 1200x624
Population Map Of The World
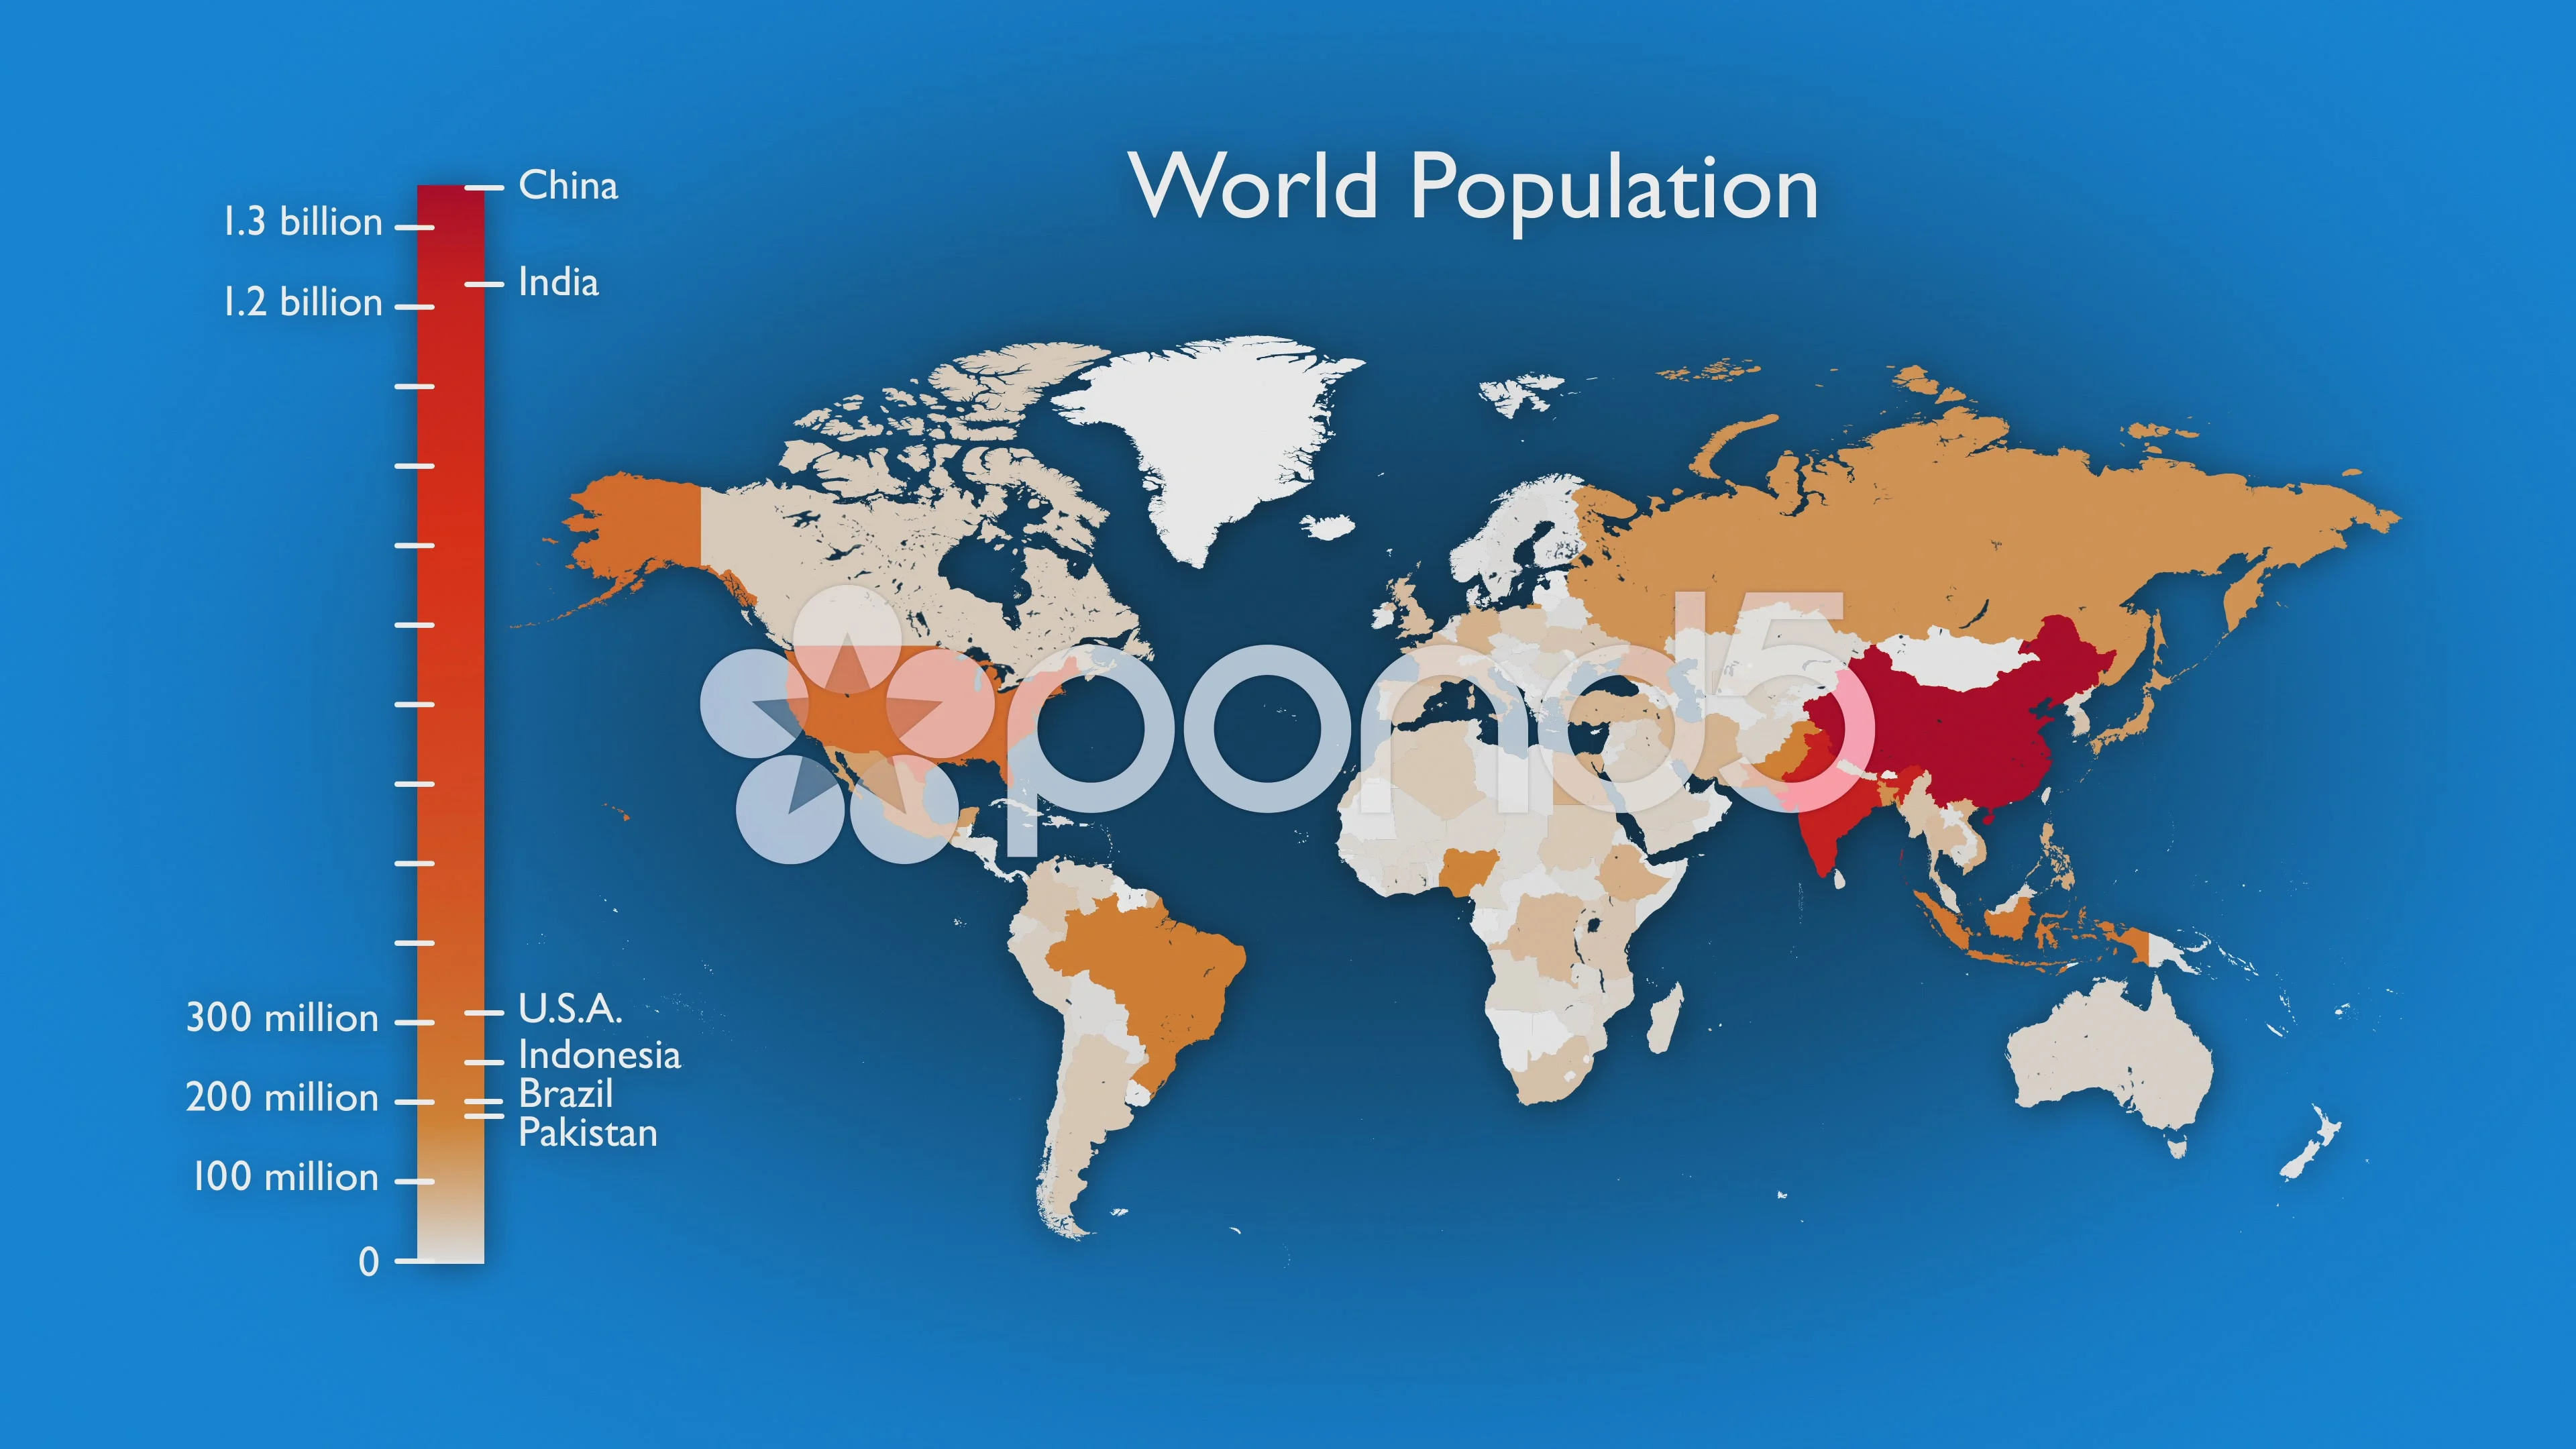
Population Map Of The World
Maps: Global Population Density - The Sounding Line
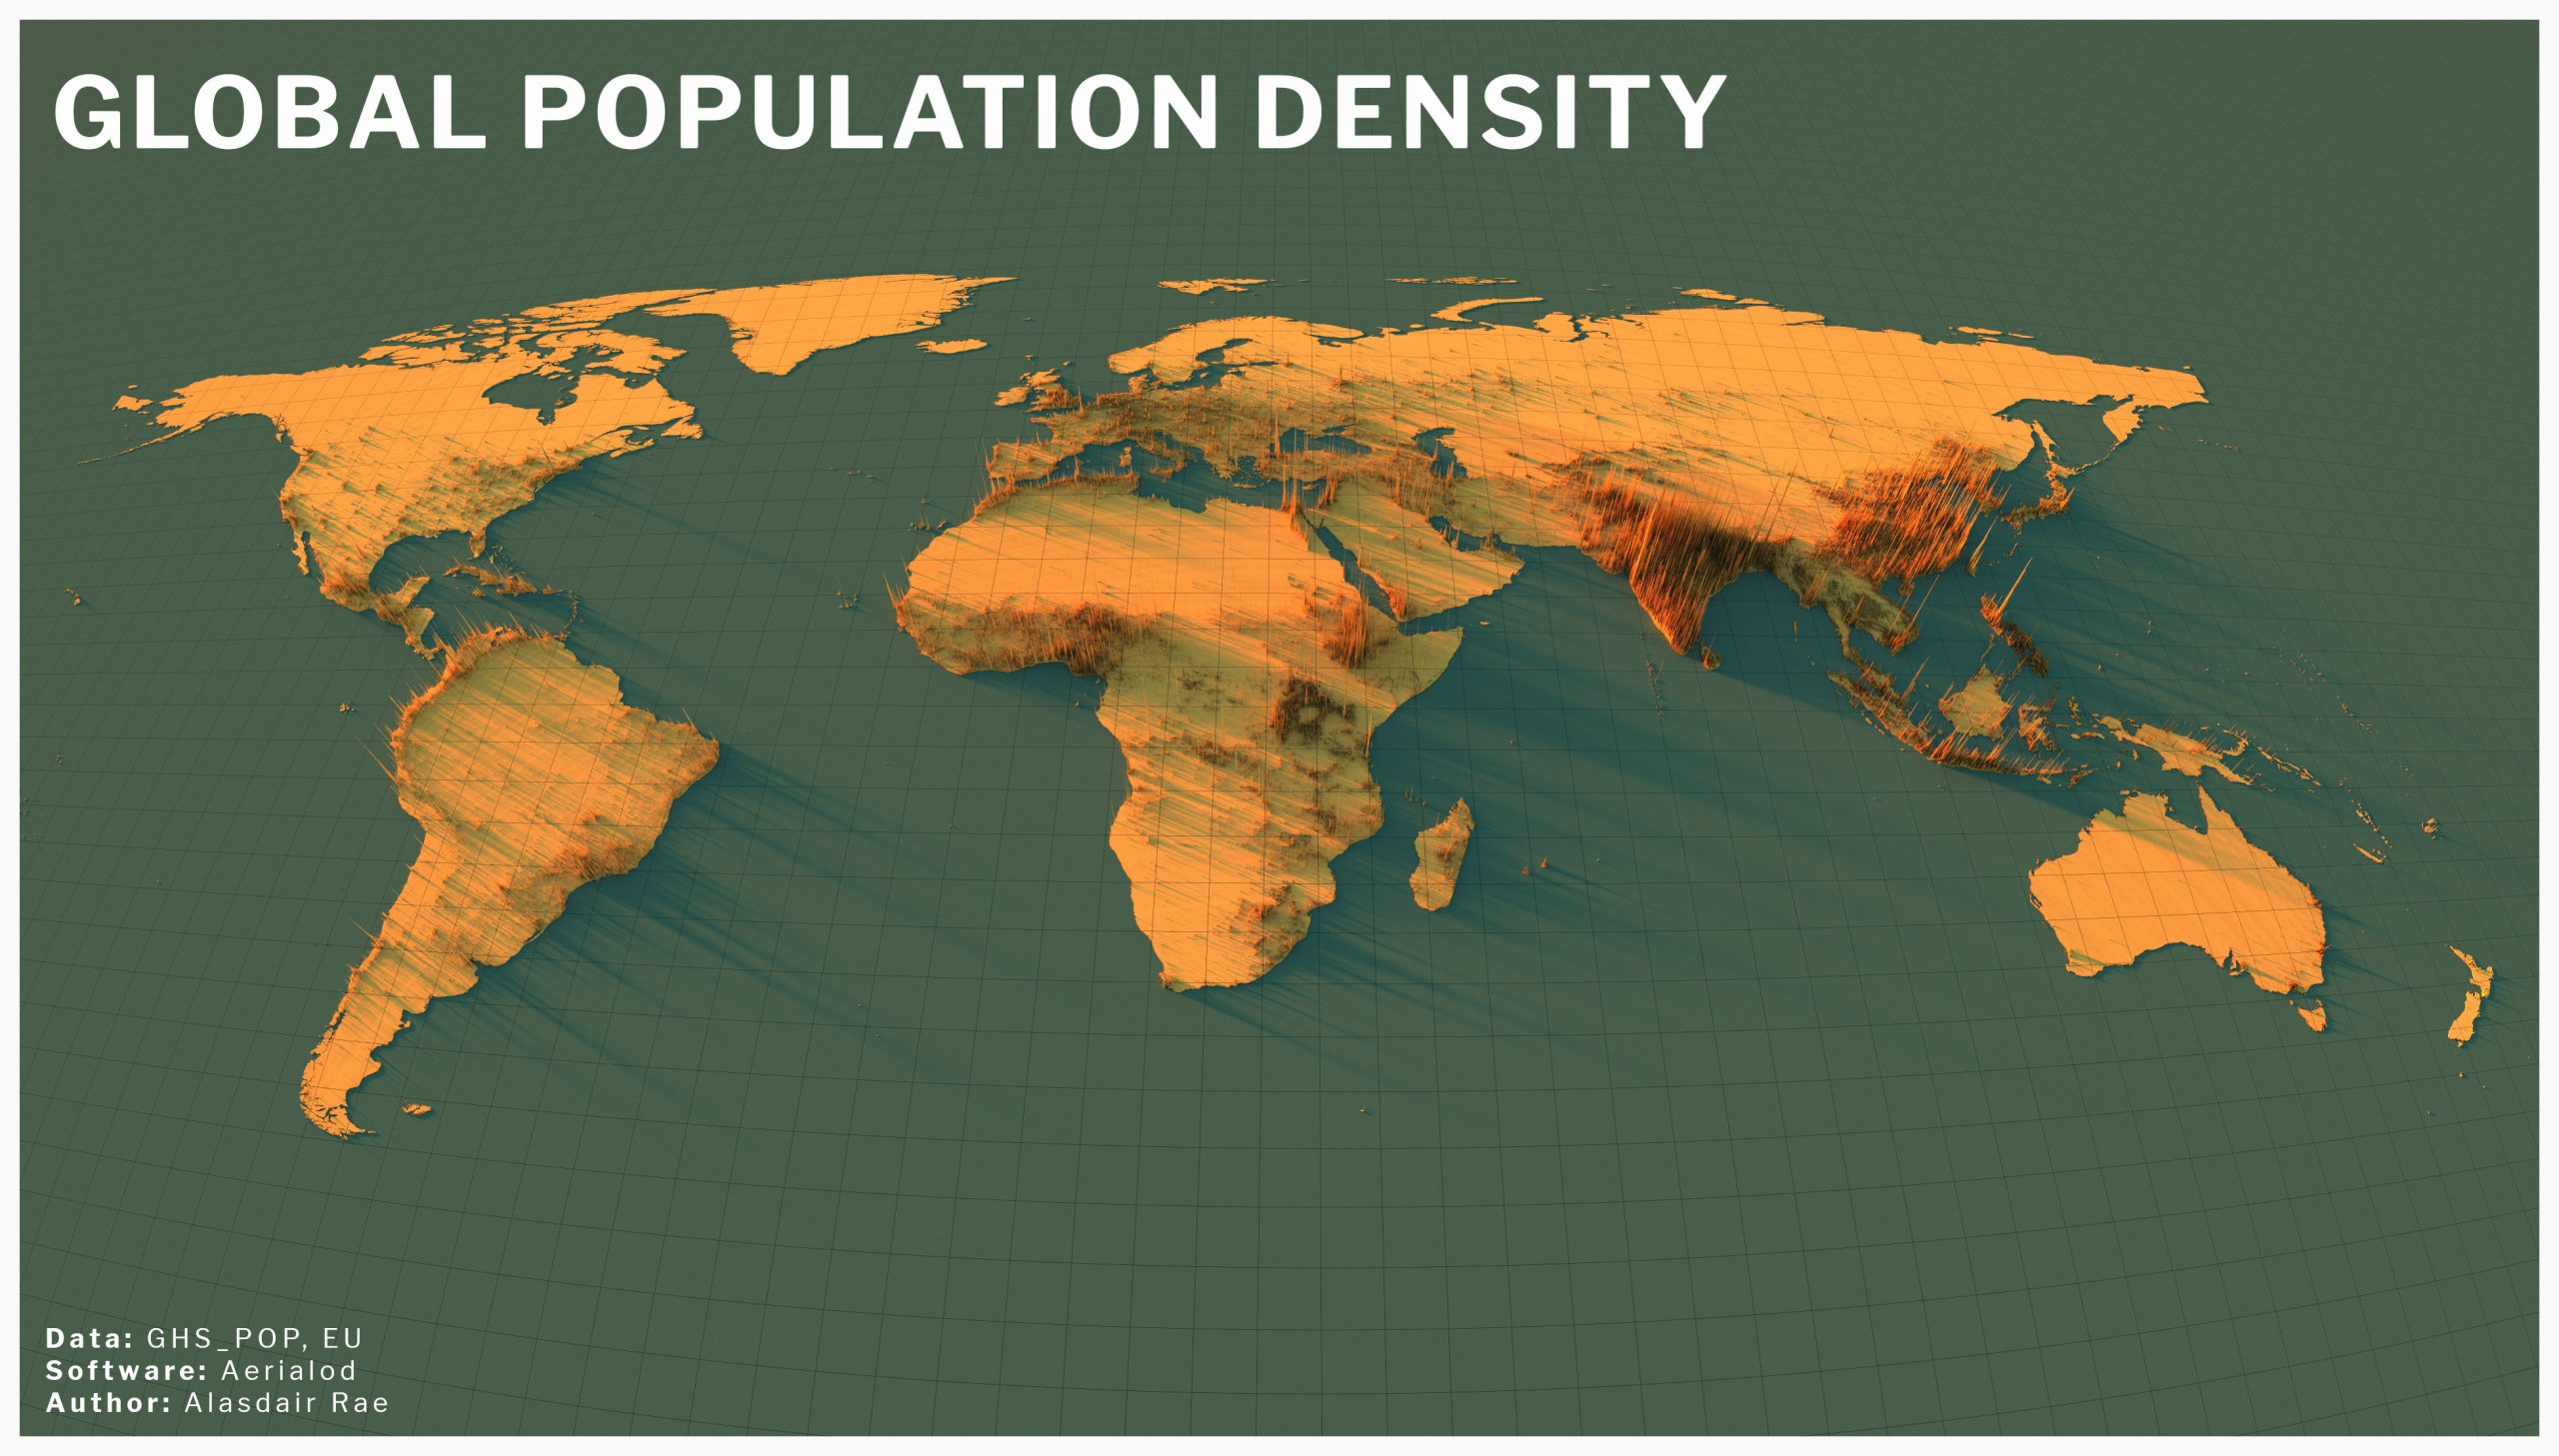
Maps: Global Population Density - The Sounding Line
World Population Distribution - An Infographic Focusing On The World's

World Population Distribution - An infographic focusing on the world's ...
Population Density Example

Population Density Example
United States Population Density Map

United States Population Density Map
Human Population Density
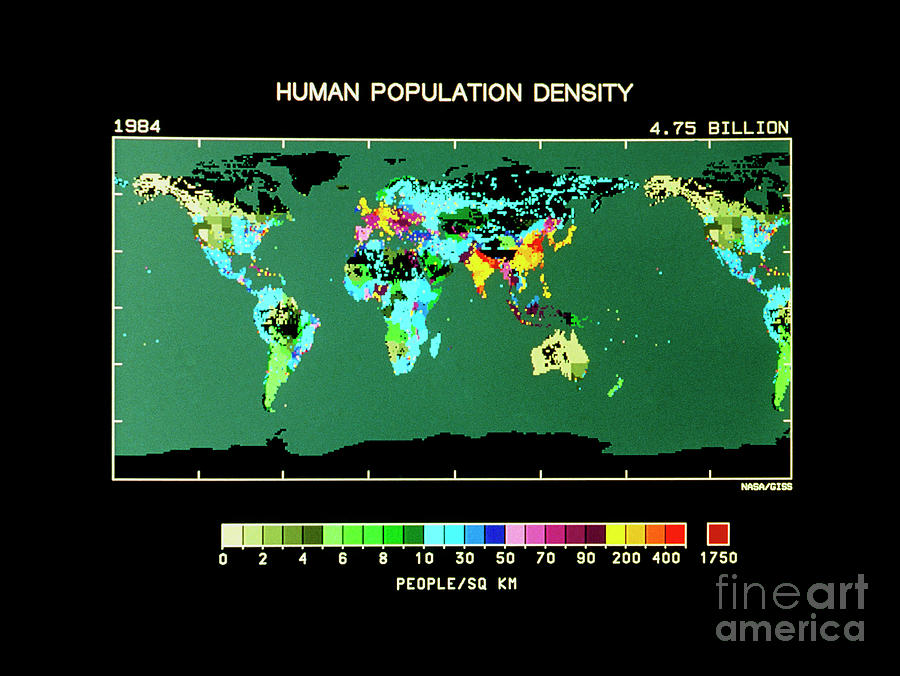
Human Population Density
File:World Population Density Map.PNG - Wikimedia Commons
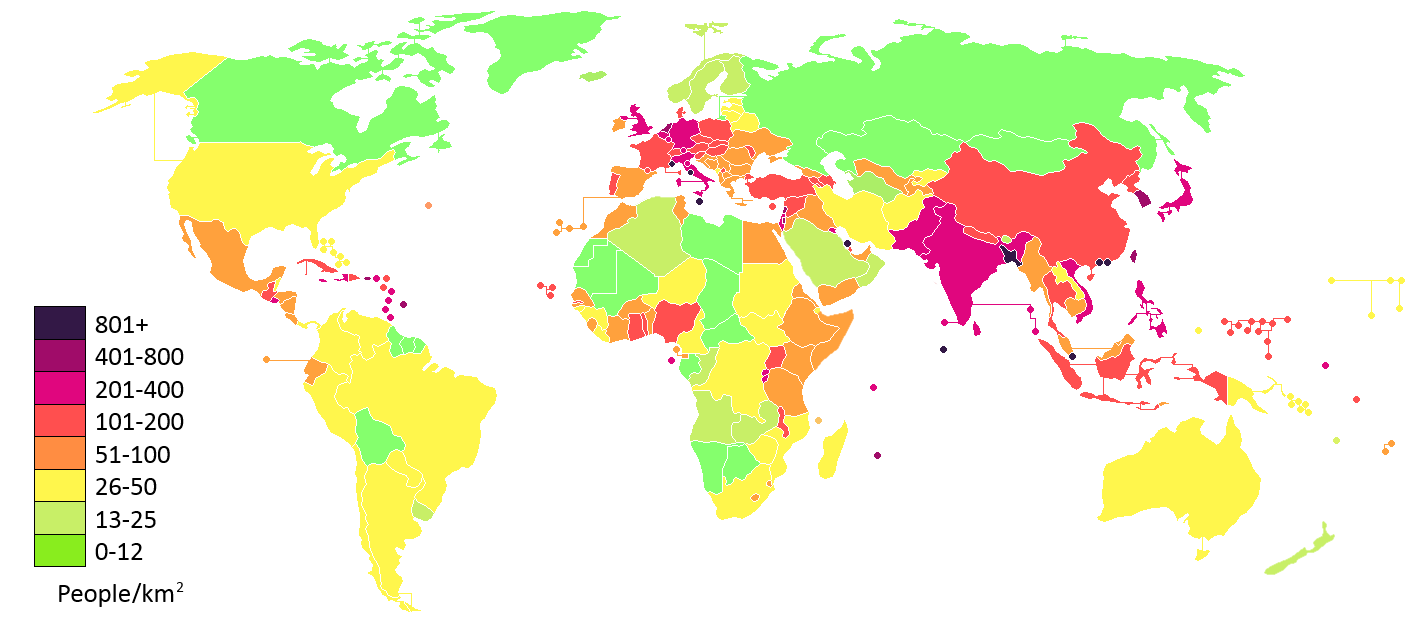
File:World population density map.PNG - Wikimedia Commons
World Map By Population Density At Daniel Shears Blog
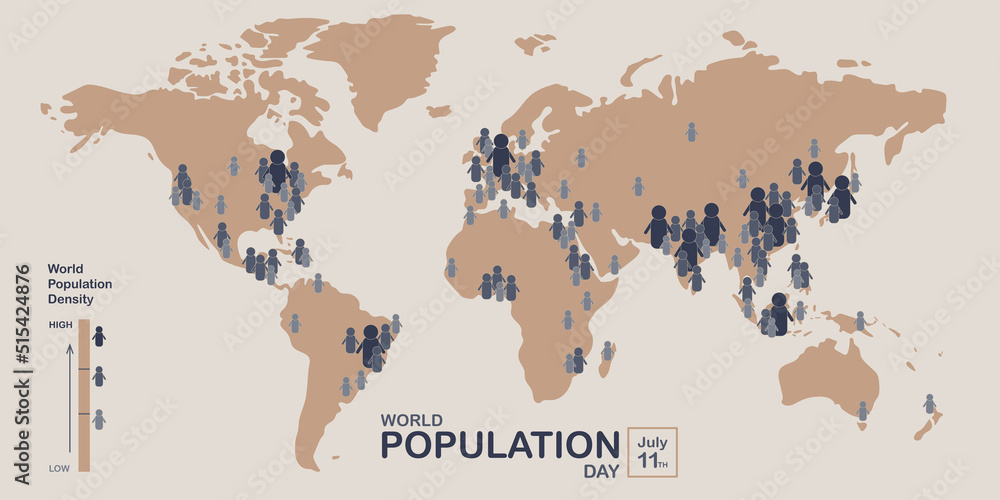
World Map By Population Density at Daniel Shears blog
Population Density Map Hi-res Stock Photography And Images - Alamy
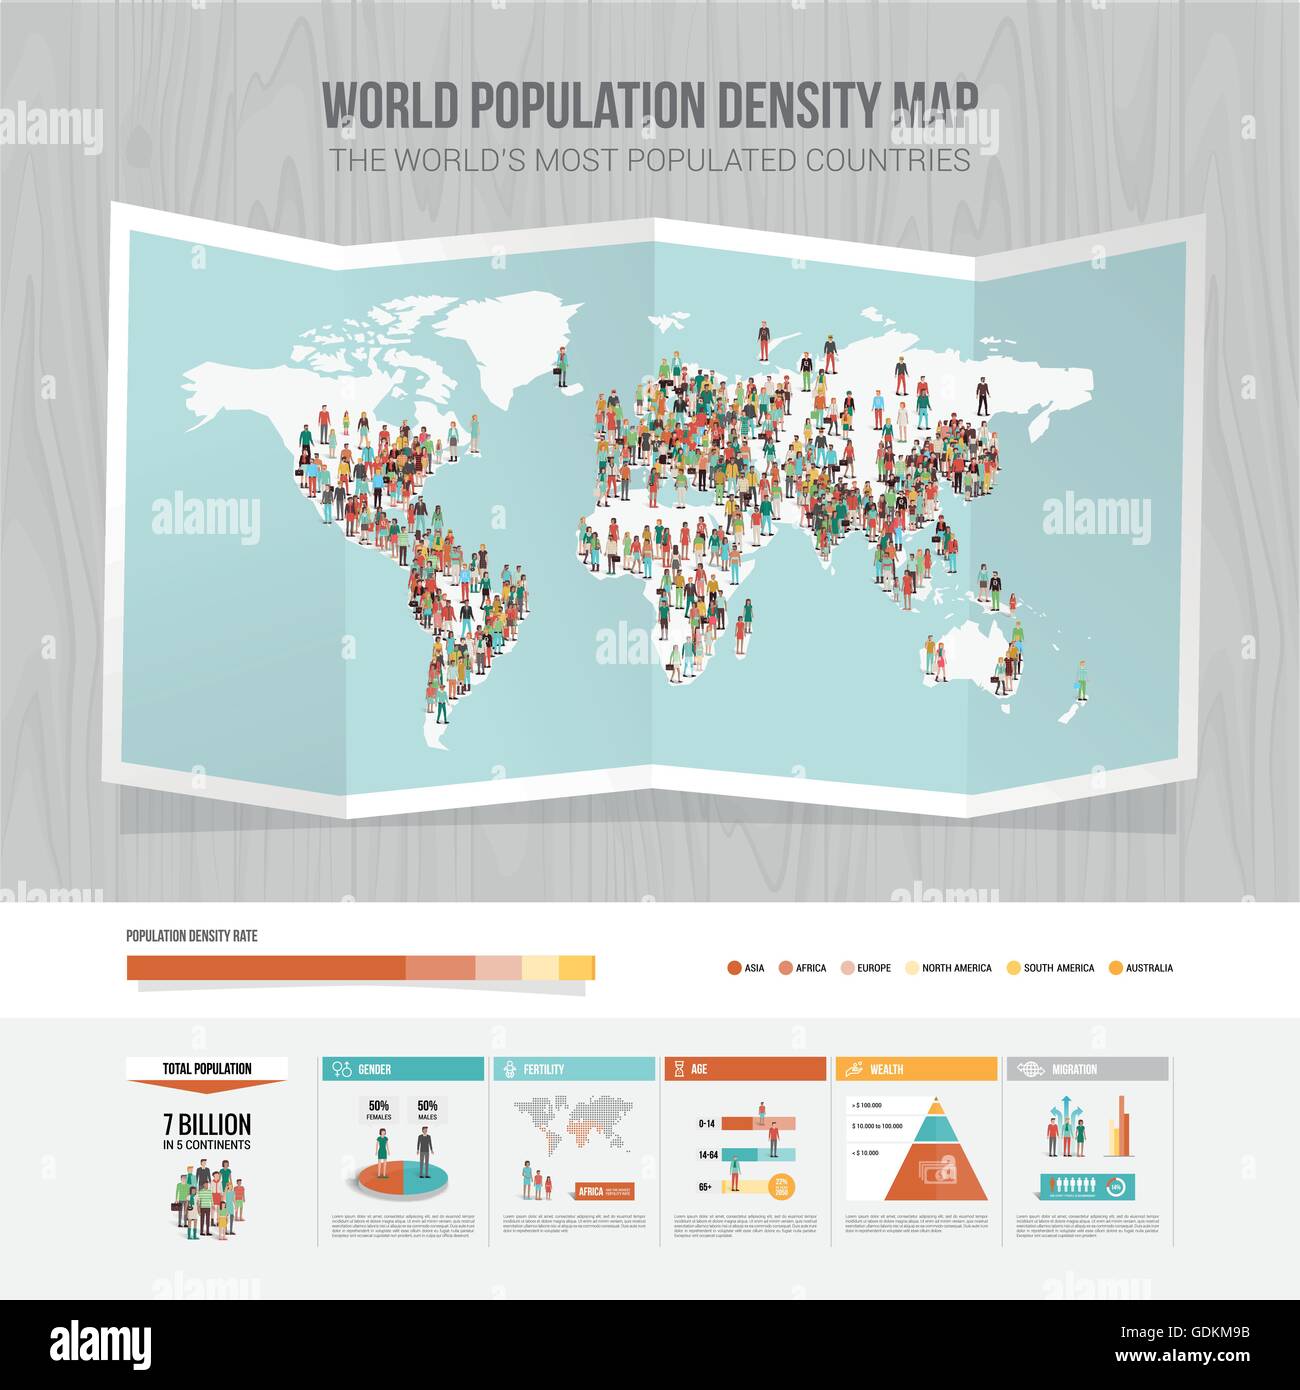
Population density map hi-res stock photography and images - Alamy
Printable World Population Map By Country In PDF

Printable World Population Map by Country in PDF
North American Population Map

North American Population Map
Number, Density And Population Growth In The Worl - Mapstor.com
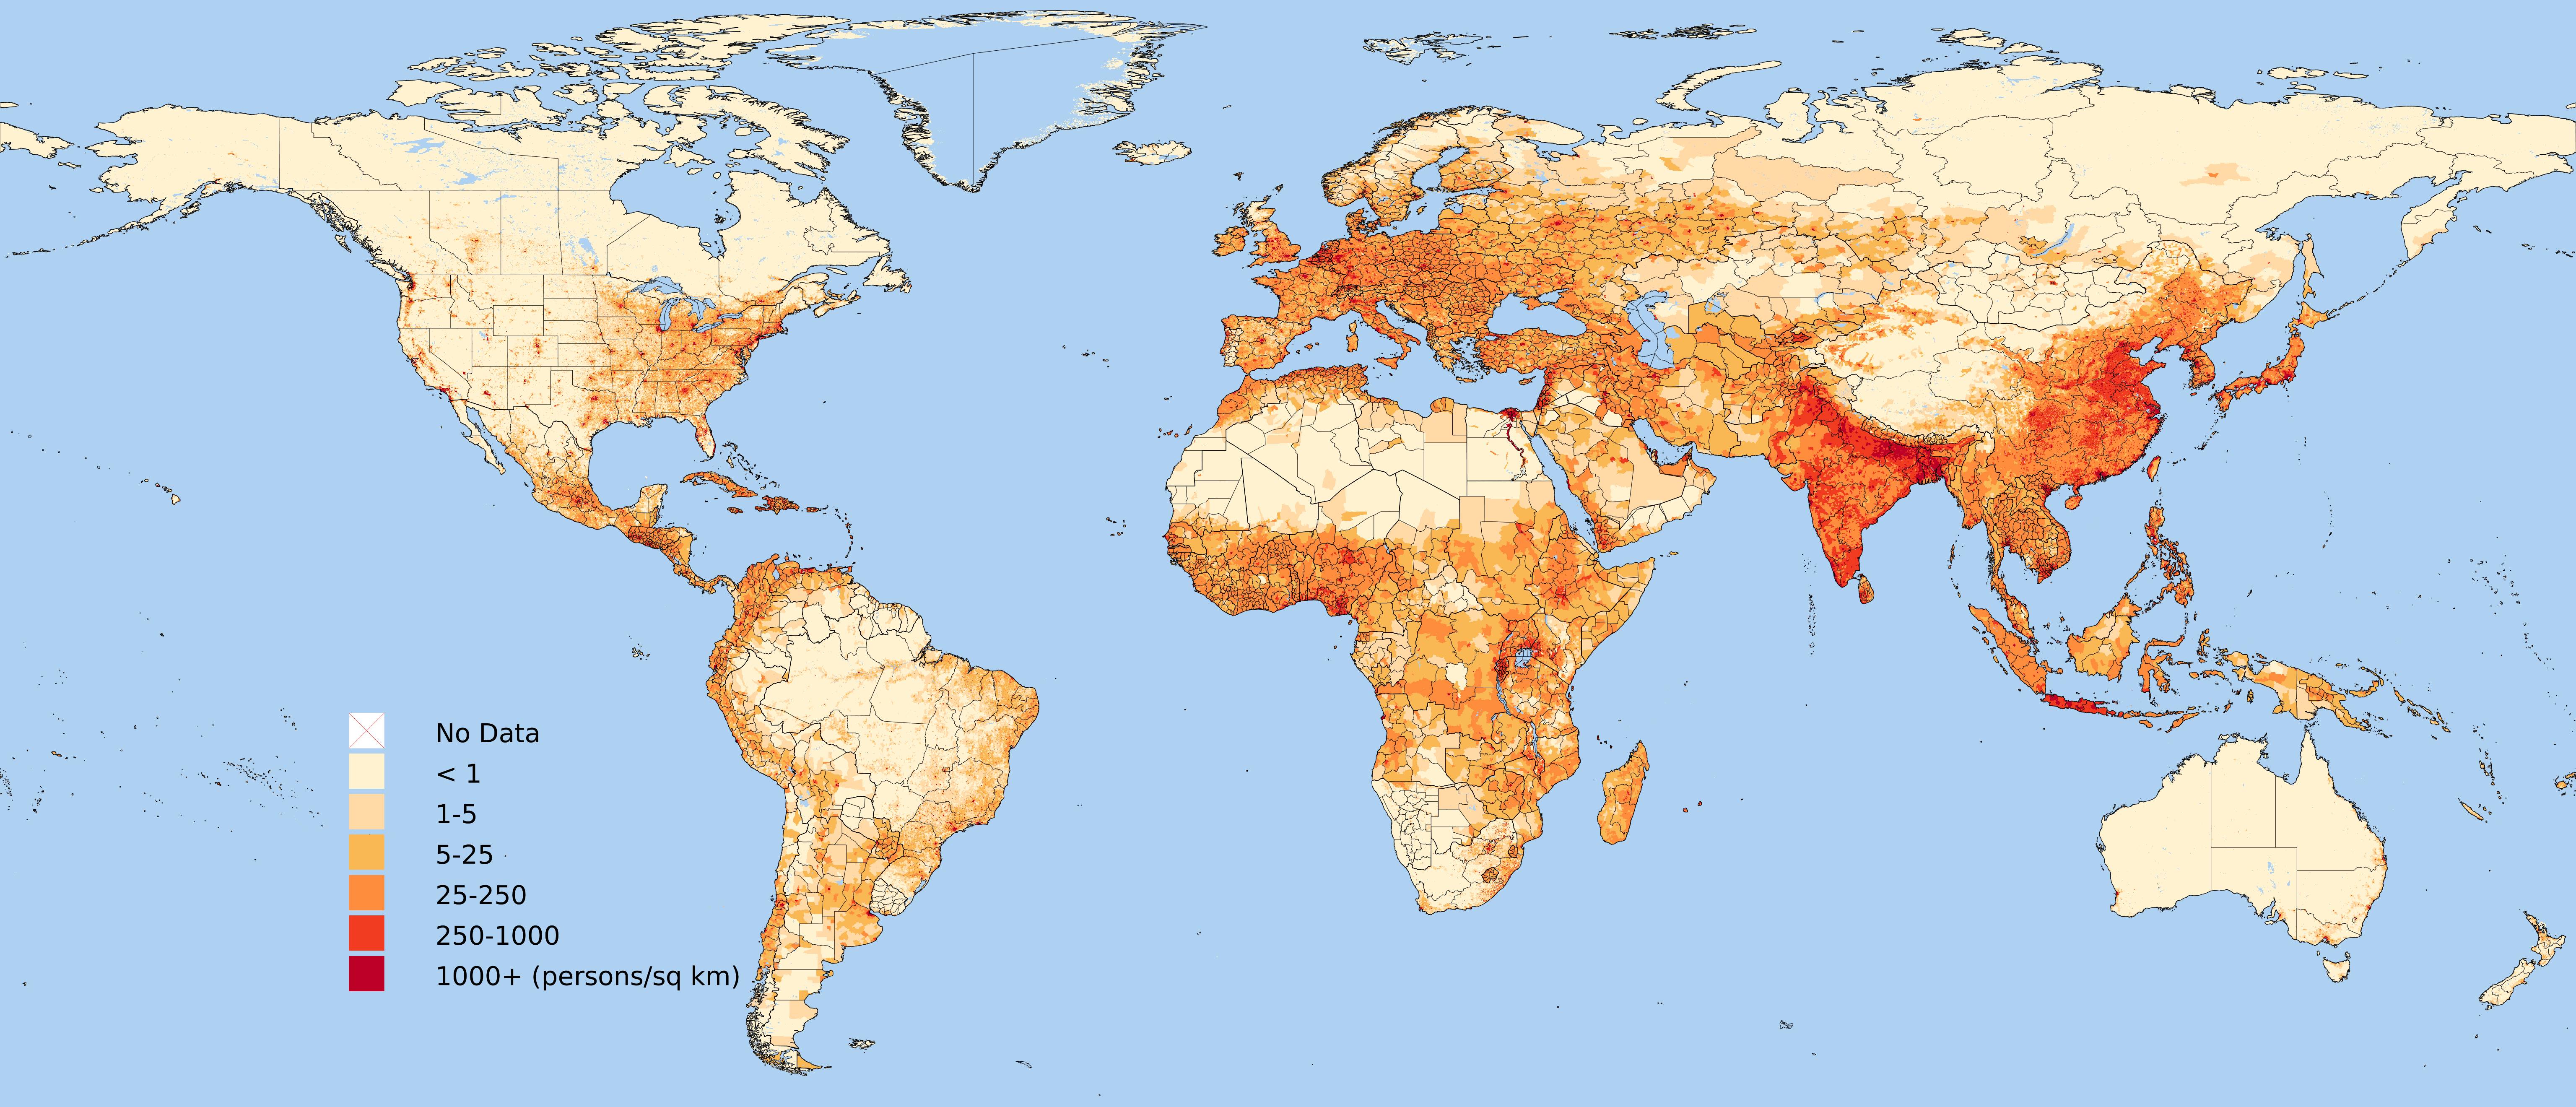
Number, density and population growth in the worl - mapstor.com
World Map By Population Density At Daniel Shears Blog
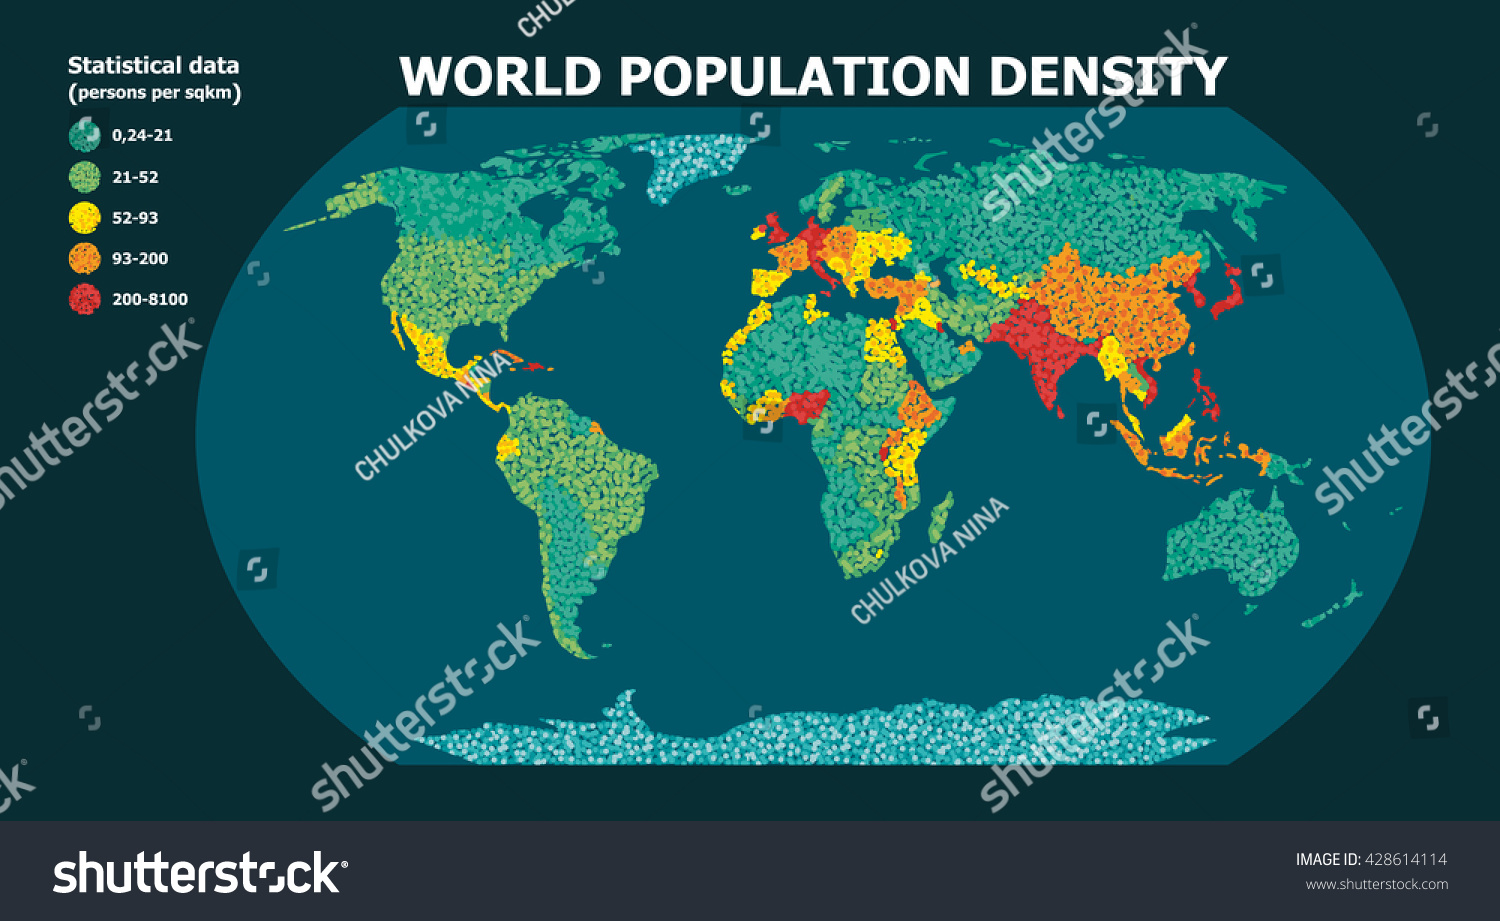
World Map By Population Density at Daniel Shears blog
Population Examples Population KS3 Geography BBC Bitesize

Population Examples Population KS3 Geography BBC Bitesize
World Population Map Lights

World Population Map Lights
World Population Density Map Update With GHSL 2023 – CityGeographics

World Population Density Map Update with GHSL 2023 – CityGeographics
Mapping Population - Population Education
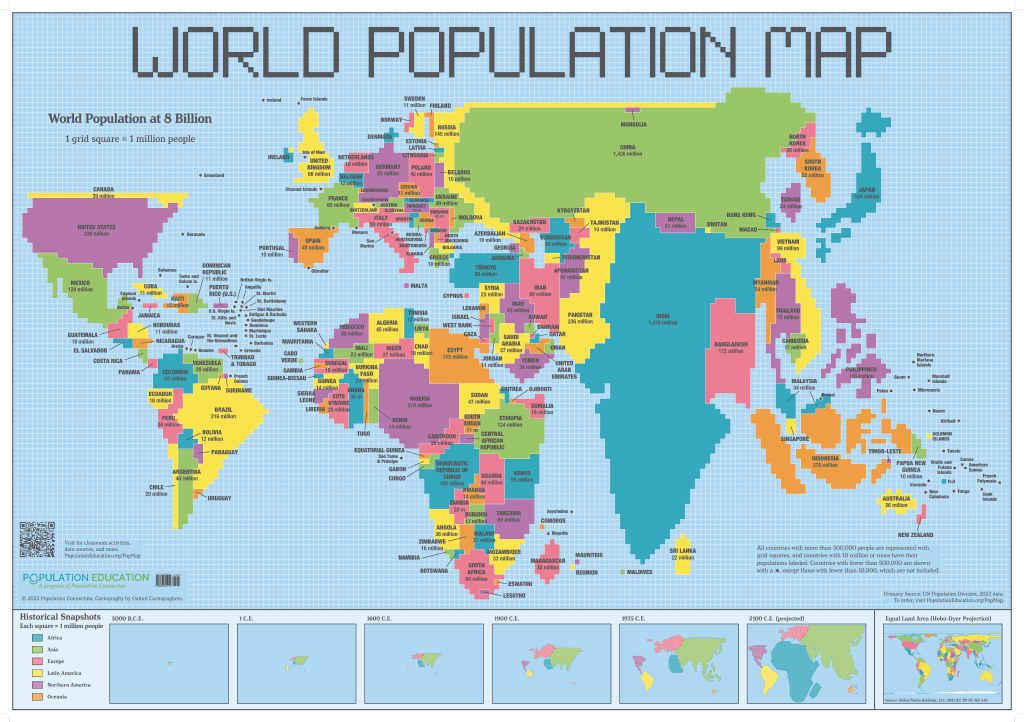
Mapping Population - Population Education
Course: Maps & GIS
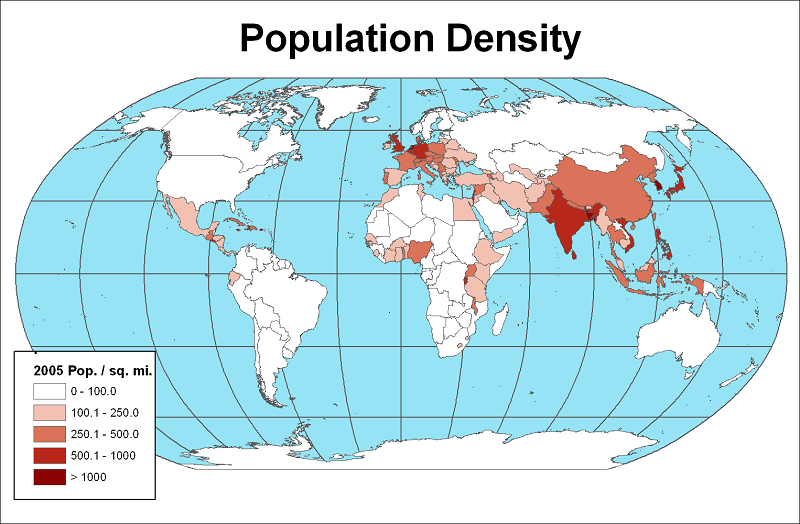
Course: Maps & GIS
Population Map Of The World
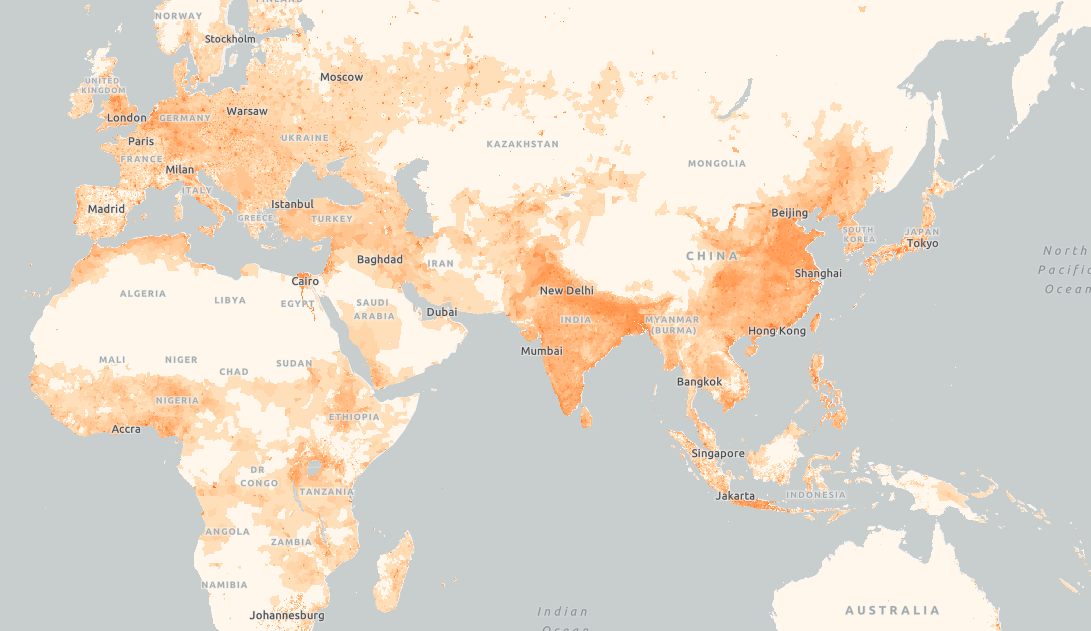
Population Map Of The World
World Population Map Where Is The World's Population Distributed? AP
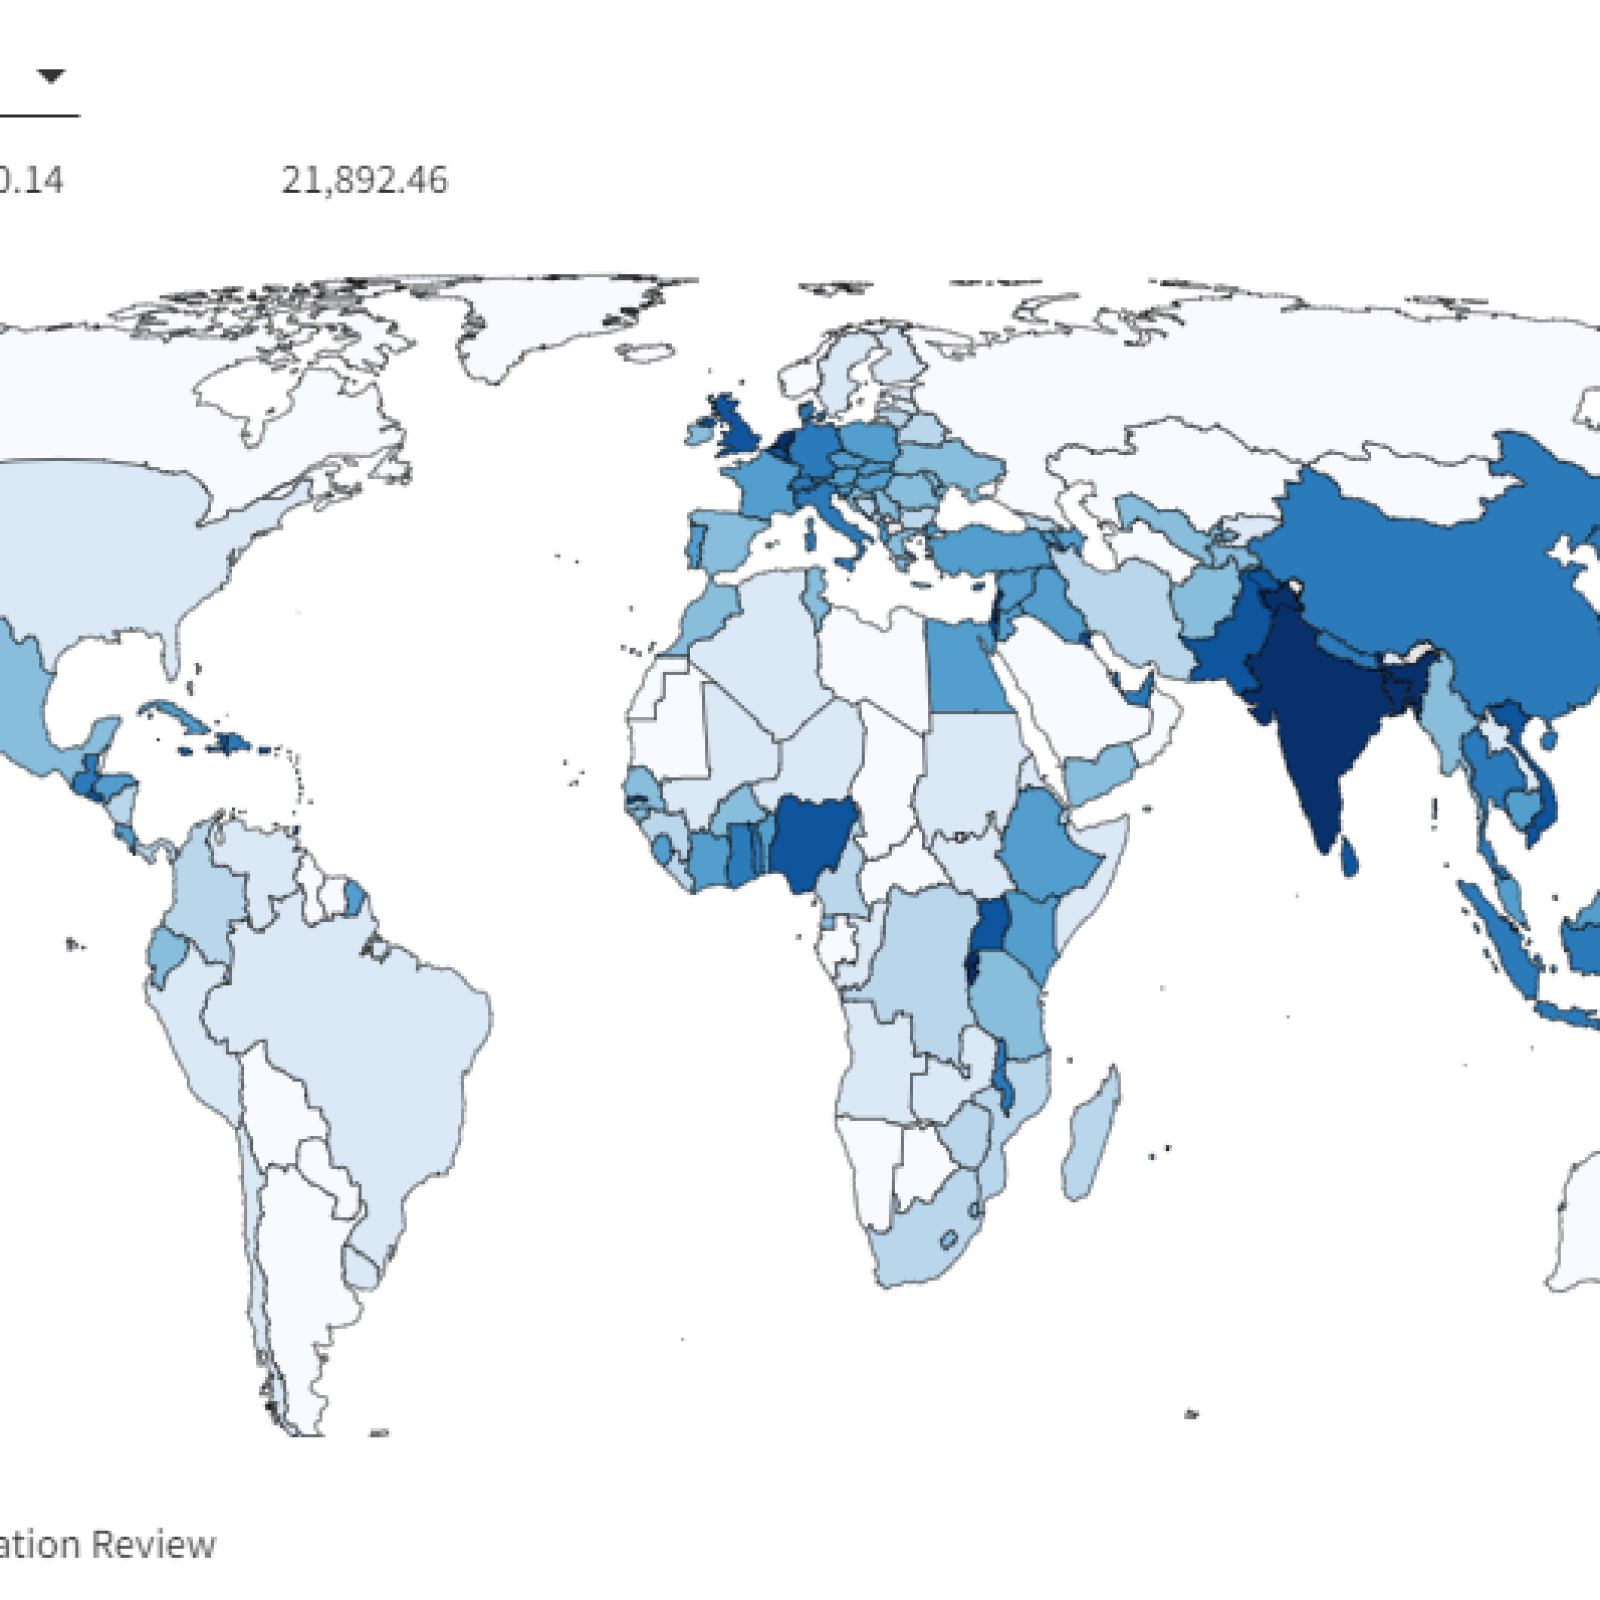
World Population Map Where Is The World's Population Distributed? AP
World Population Map Circle

World Population Map Circle
Printable Population World Map With Countries - Printables Templates Free
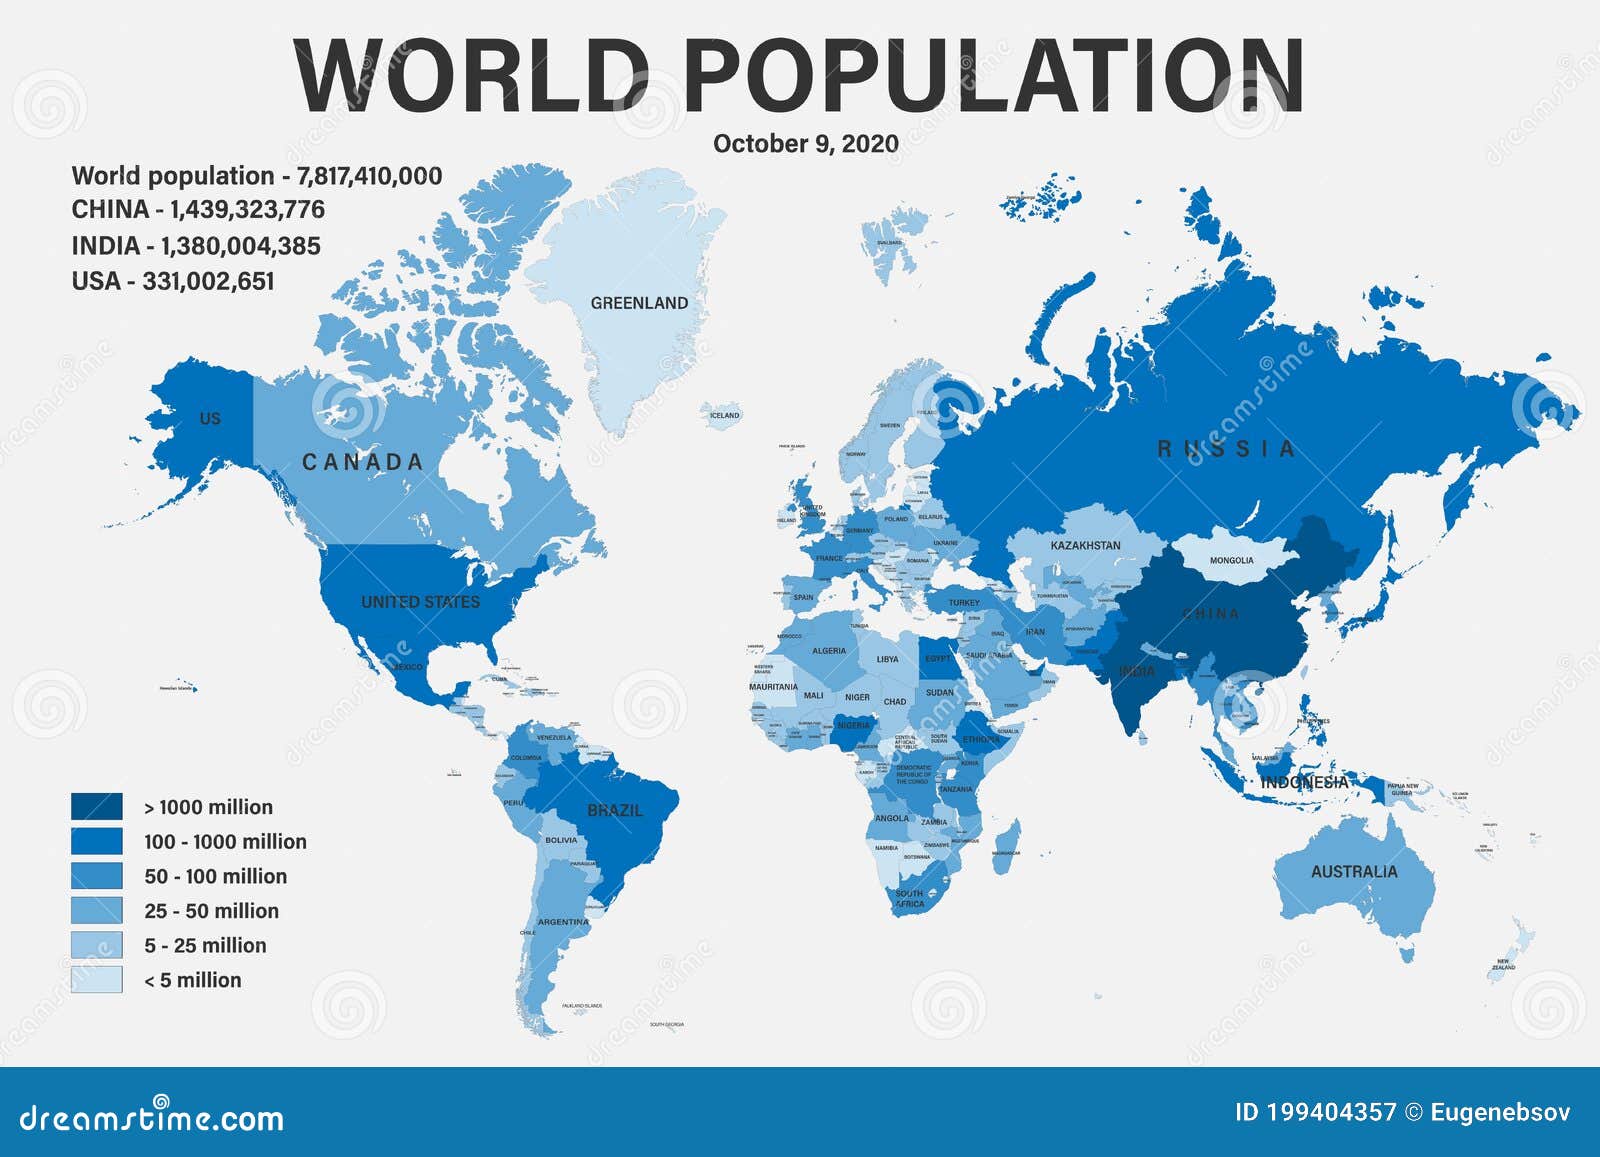
Printable Population World Map With Countries - Printables Templates Free
File:Population Density Map Of The World.svg - Wikipedia

File:Population density map of the world.svg - Wikipedia
The Changing World Population, By Country (1960 - 2022) - Vivid Maps

The Changing World Population, by Country (1960 - 2022) - Vivid Maps
Population Density Map Of The World Choropleth Maps Data Shown On
Population Density Map Of The World Choropleth Maps Data Shown On
