US State Population Density Rankings: Who's Most Crowded and Who's Most Spacious?
In the United States, population density varies dramatically from state to state, with the most compact areas located in the Northeast and the most expansive in the West. According to the latest data, New Jersey tops the list with roughly 1,250 people per square mile, while Alaska lags far behind at about 1.3 people per square mile. These extremes not only highlight regional settlement patterns but also influence infrastructure, resource allocation, and political representation across the country.
Population Density Context
Population density is measured by dividing the number of residents by the land area in square miles. States such as New Jersey, Rhode Island, and Massachusetts consistently rank in the top five, reflecting long histories of urban development and limited geographic space. In contrast, states like Wyoming, Montana, and North Dakota rank at the bottom, illustrating vast landscapes with sparse populations. Understanding these figures is essential for effective urban planning and disaster preparedness, as densely populated regions may experience higher demands for public services, transportation networks, and housing.

State‑Level Details
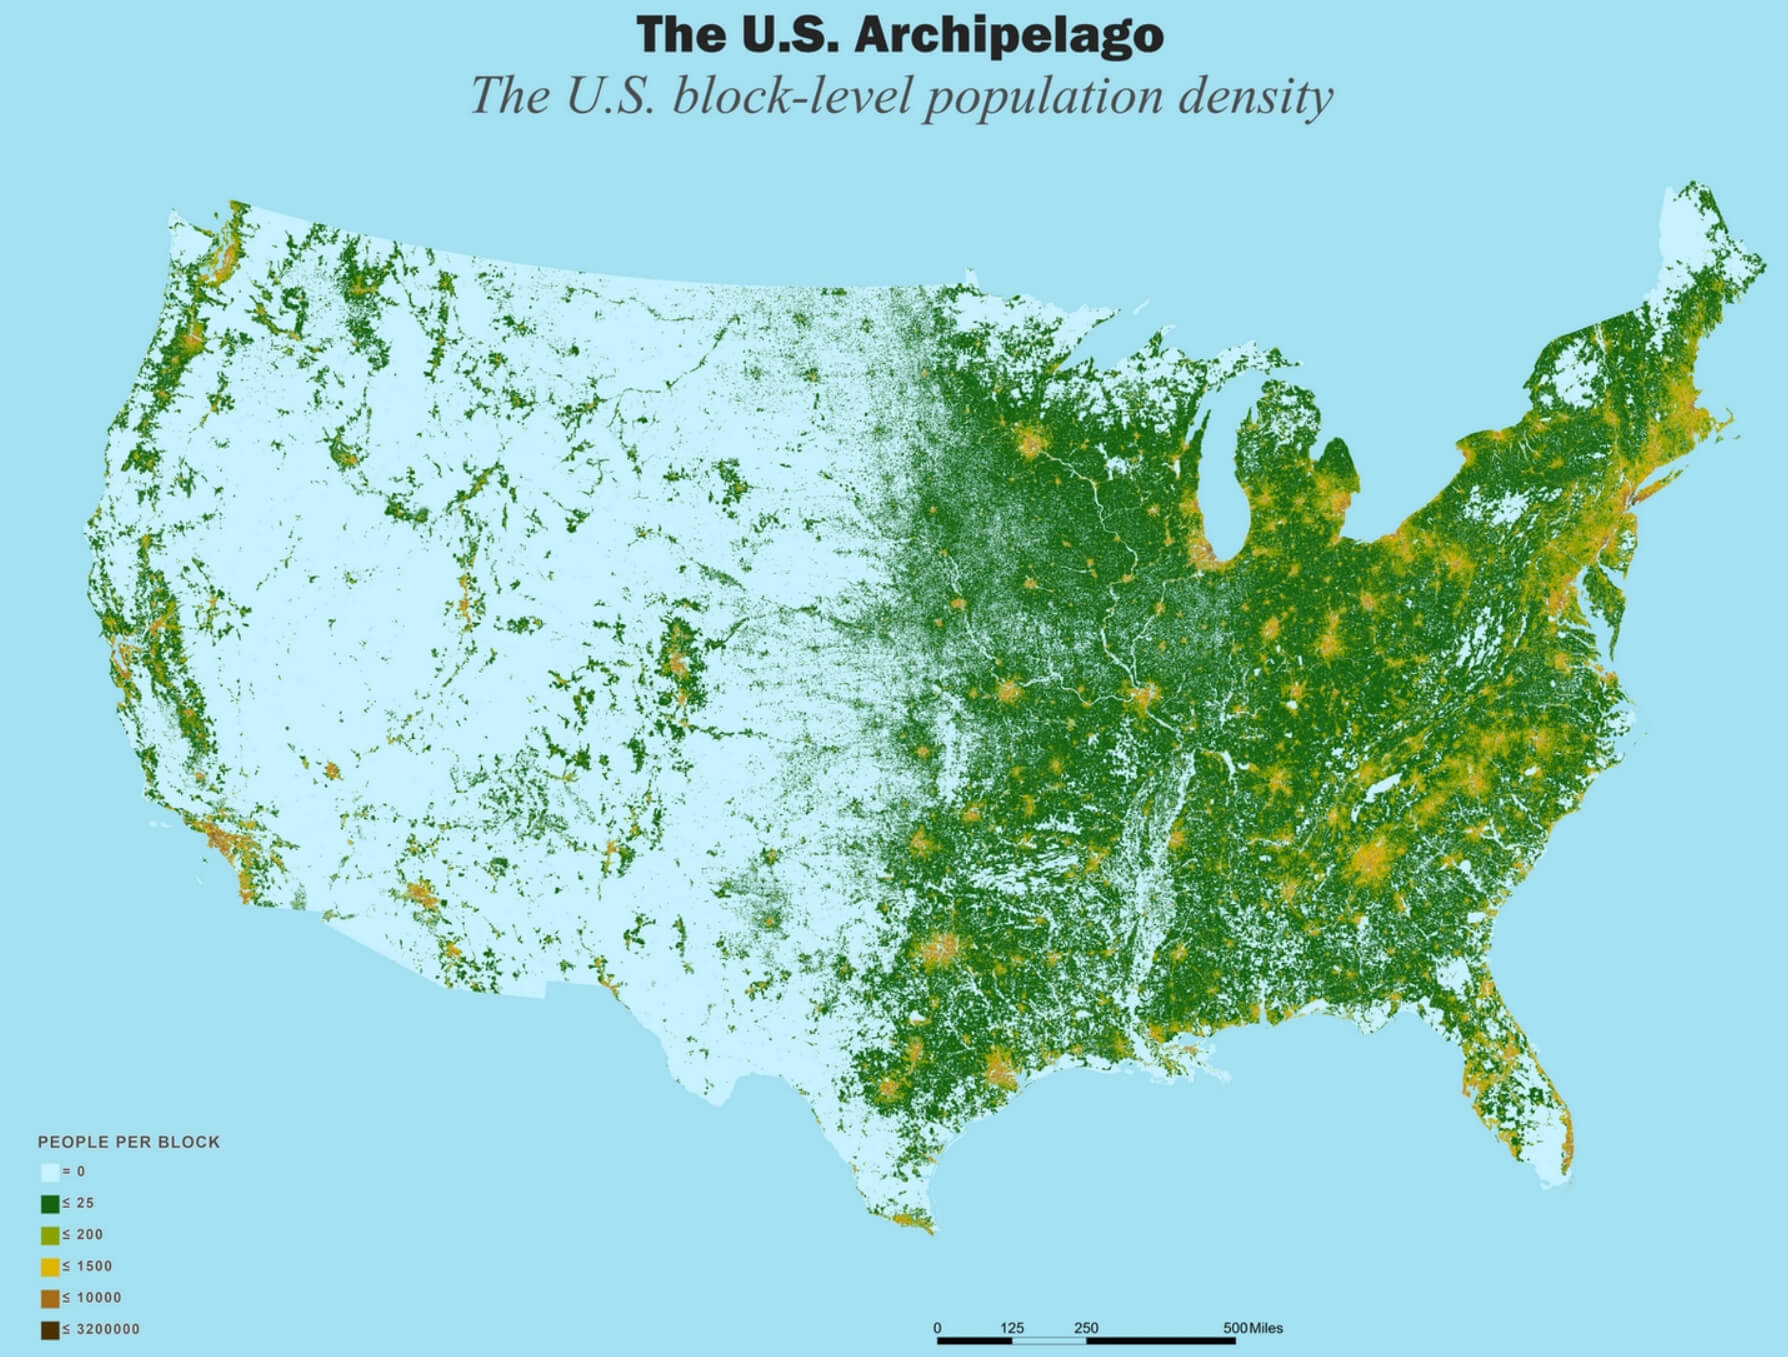
Beyond overall rankings, individual state characteristics reveal deeper insights. For example, New Jersey’s density is fueled by major metropolitan hubs like Newark and Jersey City, while Alaska’s low density is a product of its remote villages and reliance on air travel. The 2024 population density map shows clusters of high density in urban corridors, especially along the East Coast and the Great Lakes region, and highlights the sprawling nature of the Southwestern states. These patterns directly affect electoral districts, school zoning, and economic development initiatives, underscoring the need for tailored policies that address both densely populated and sparsely populated areas.
Implications for Policy and Planning
The stark contrast between highly dense and low density states has significant policy implications. In high‑density states, planners must focus on mitigating congestion, expanding public transit, and ensuring affordable housing. Conversely, low‑density states face challenges such as maintaining extensive road networks, providing healthcare access over large areas, and supporting industries that depend on natural resources. Moreover, the distribution of population density influences federal funding formulas, emergency response planning, and climate adaptation strategies. As the United States continues to grow and evolve, policymakers must balance the needs of both ends of the density spectrum to foster equitable and sustainable development across all regions.
U.S. Population Density (1990 - 2017) - Vivid Maps

U.S. Population Density (1990 - 2017) - Vivid Maps
Population Density In The U.S., By State 2023| Statista
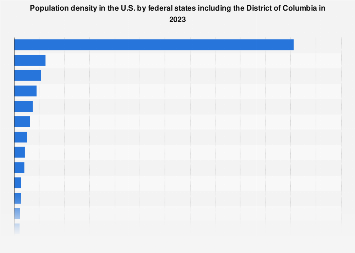
Population density in the U.S., by state 2023| Statista
United States Population Density Map

United States Population Density Map
Top 10 States By Population Density At Kaitlyn Fitzhardinge Blog

Top 10 States By Population Density at Kaitlyn Fitzhardinge blog
US Population Density Map - Guide Of The World
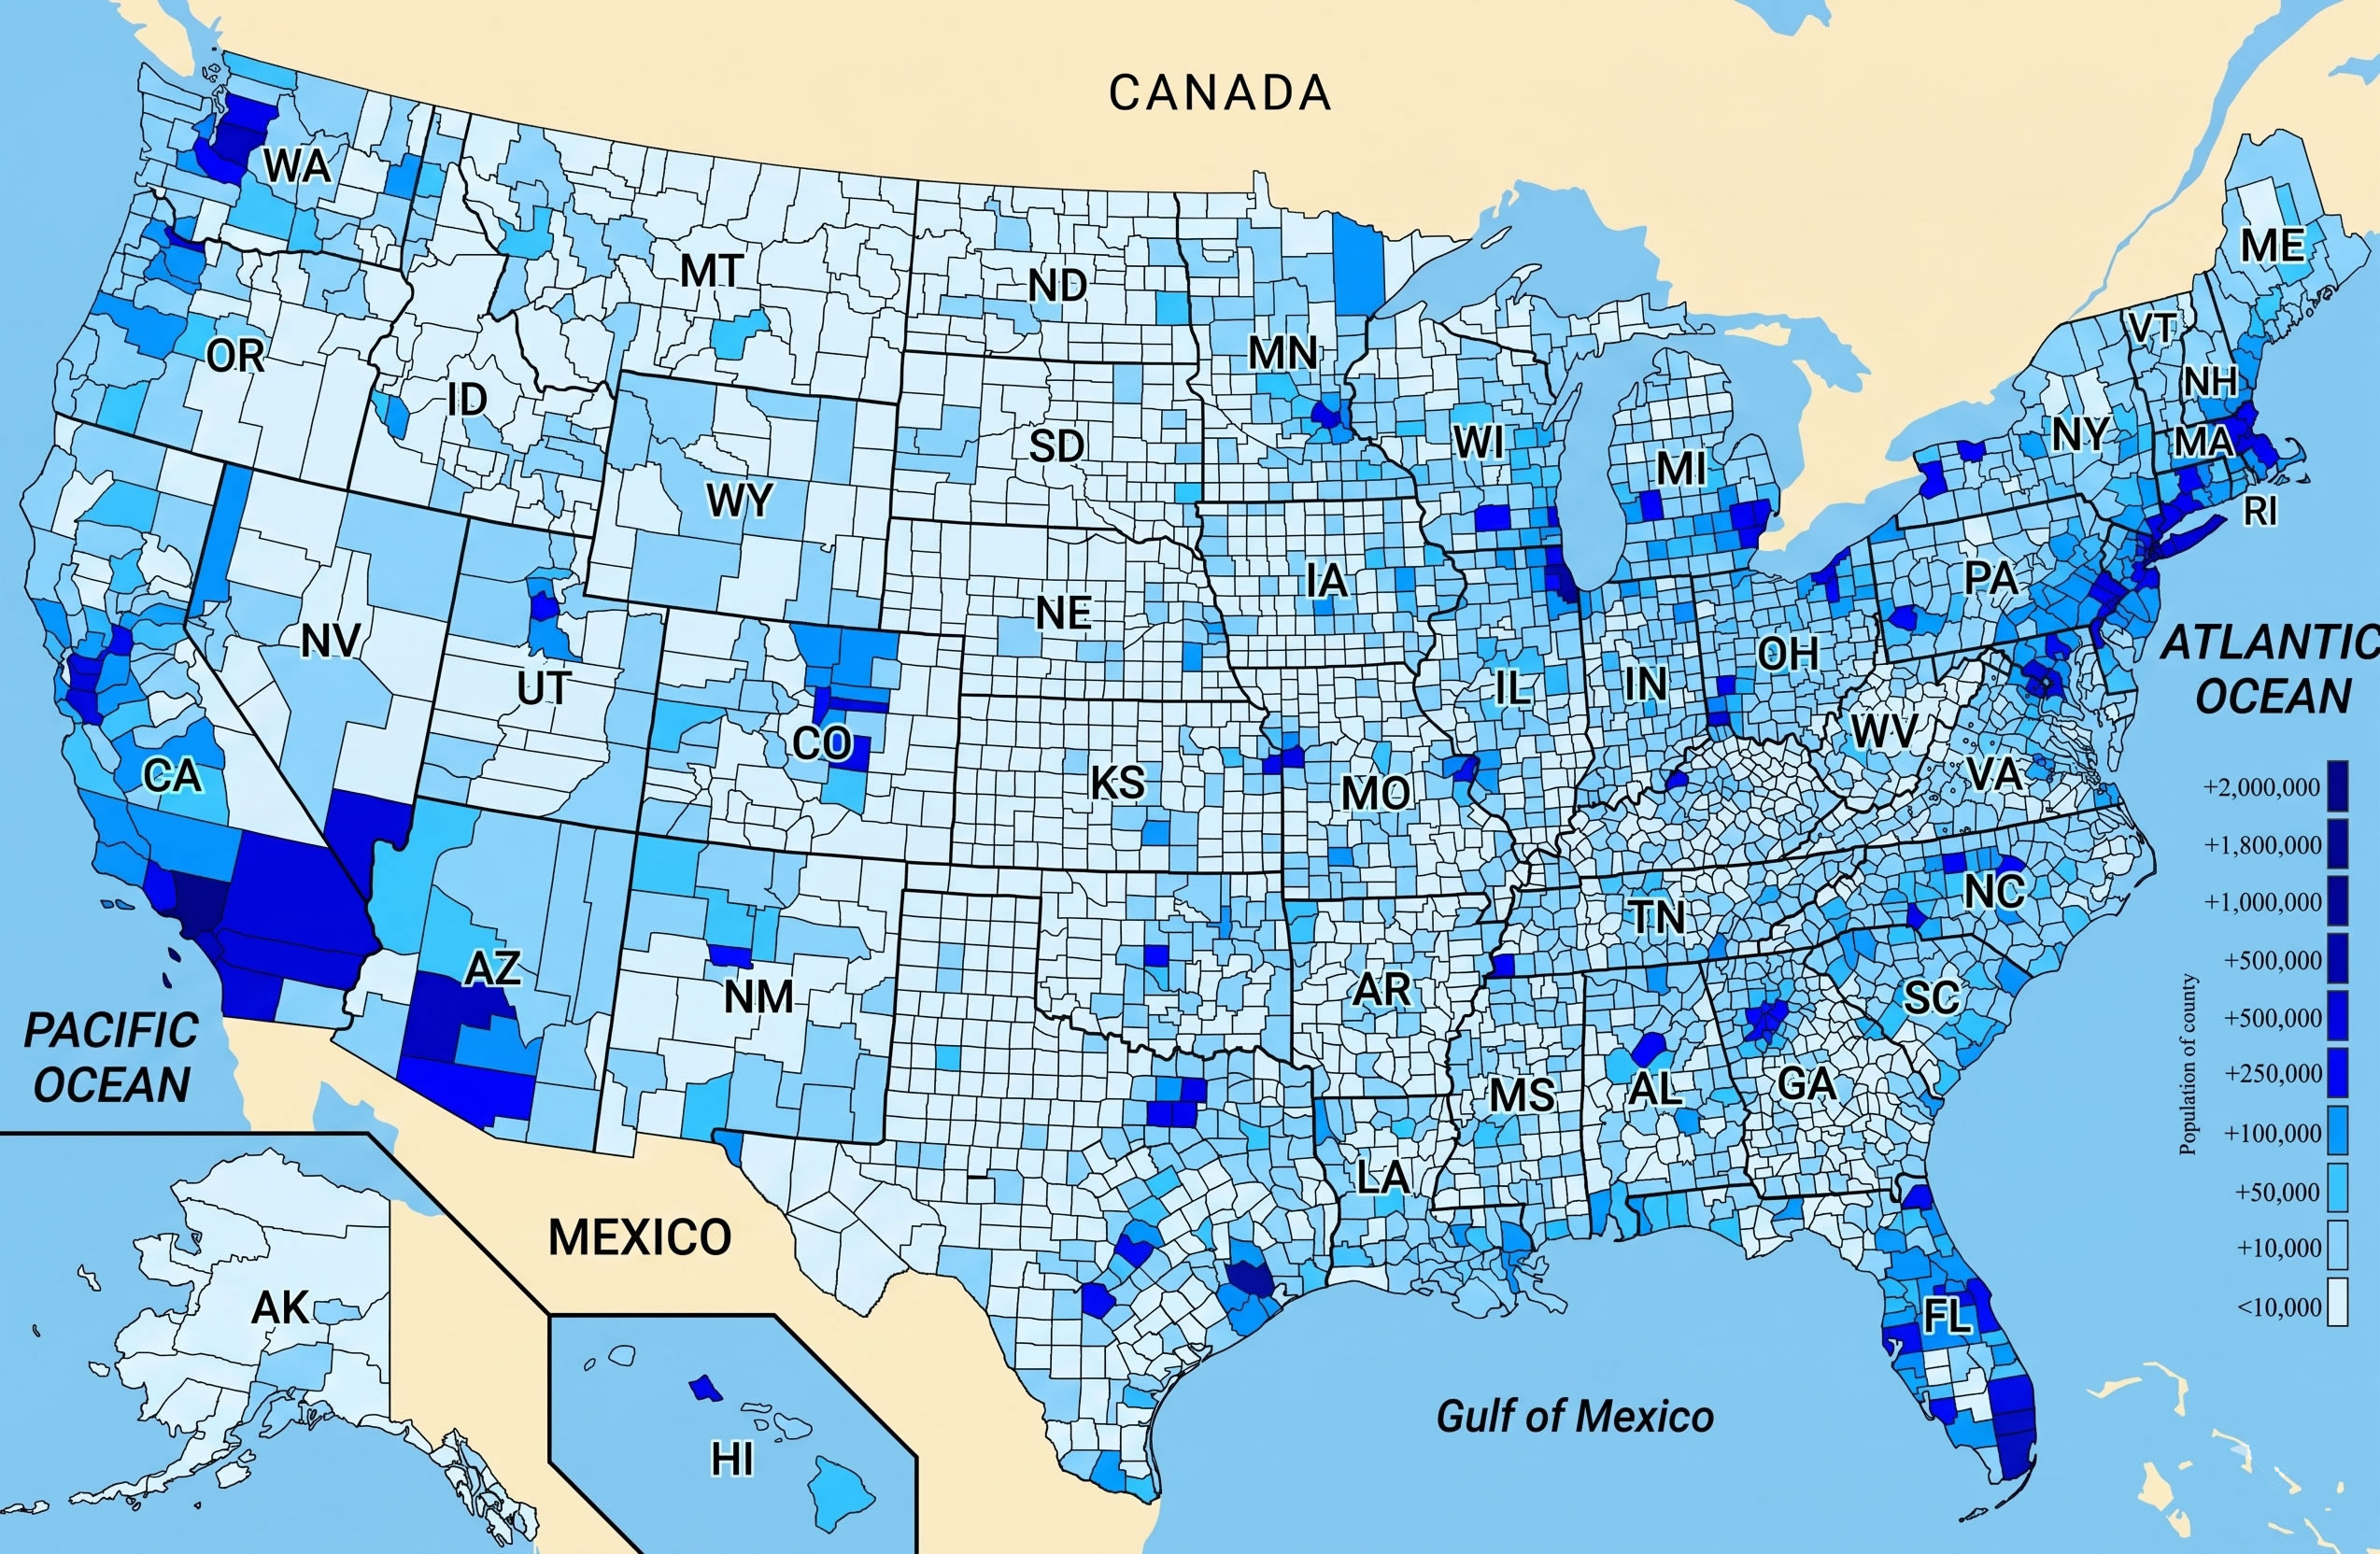
US Population Density Map - Guide of the World
US States By Population Density -- Stocking Blue
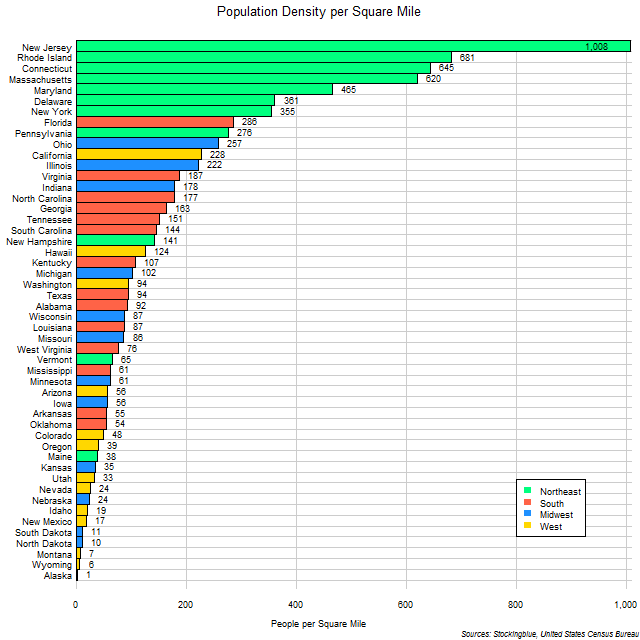
US States by Population Density -- Stocking Blue
State Population Density Usa – Population Density By State 2025 – CREM

State Population Density Usa – Population Density By State 2025 – CREM
Usa Population Density Map
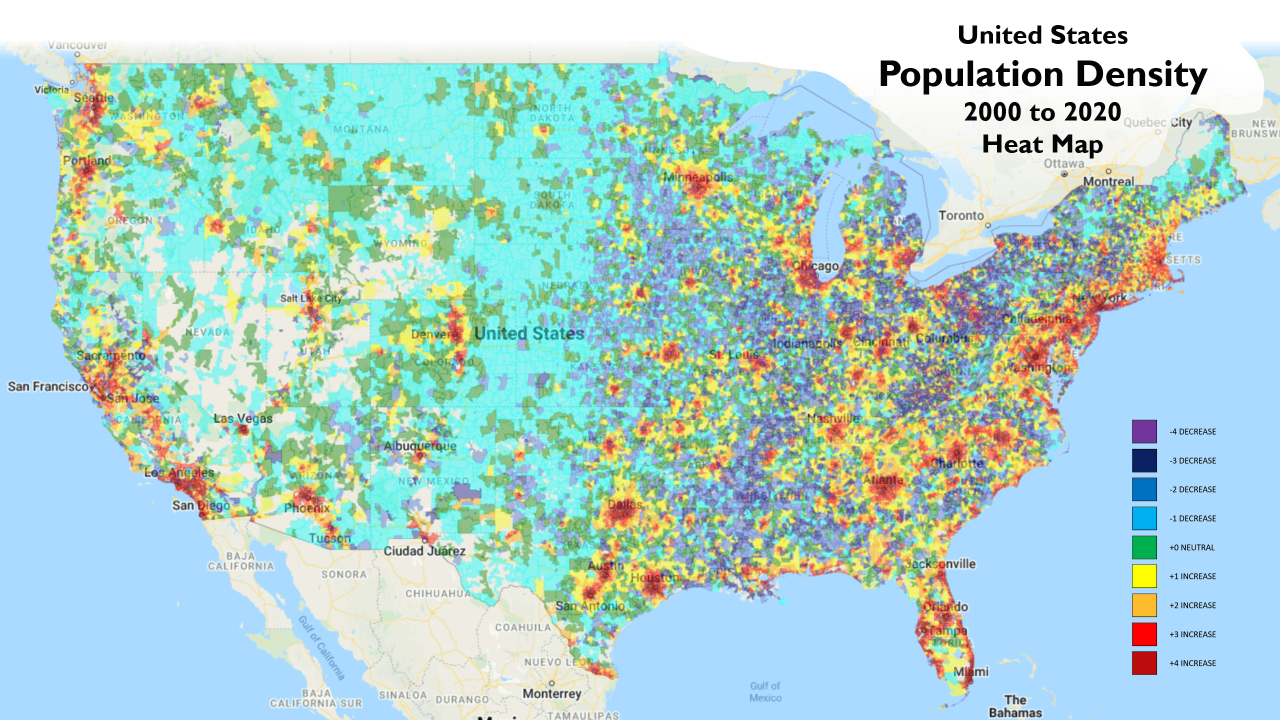
Usa Population Density Map
Top 25 States By Population At Ronald Caster Blog

Top 25 States By Population at Ronald Caster blog
Calculating The Population Density Of The United States Chart | TPT
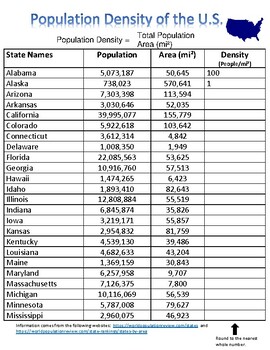
Calculating the Population Density of the United States Chart | TPT
Population Density Map Of USA 2025

Population Density Map of USA 2025
US Population Density Map
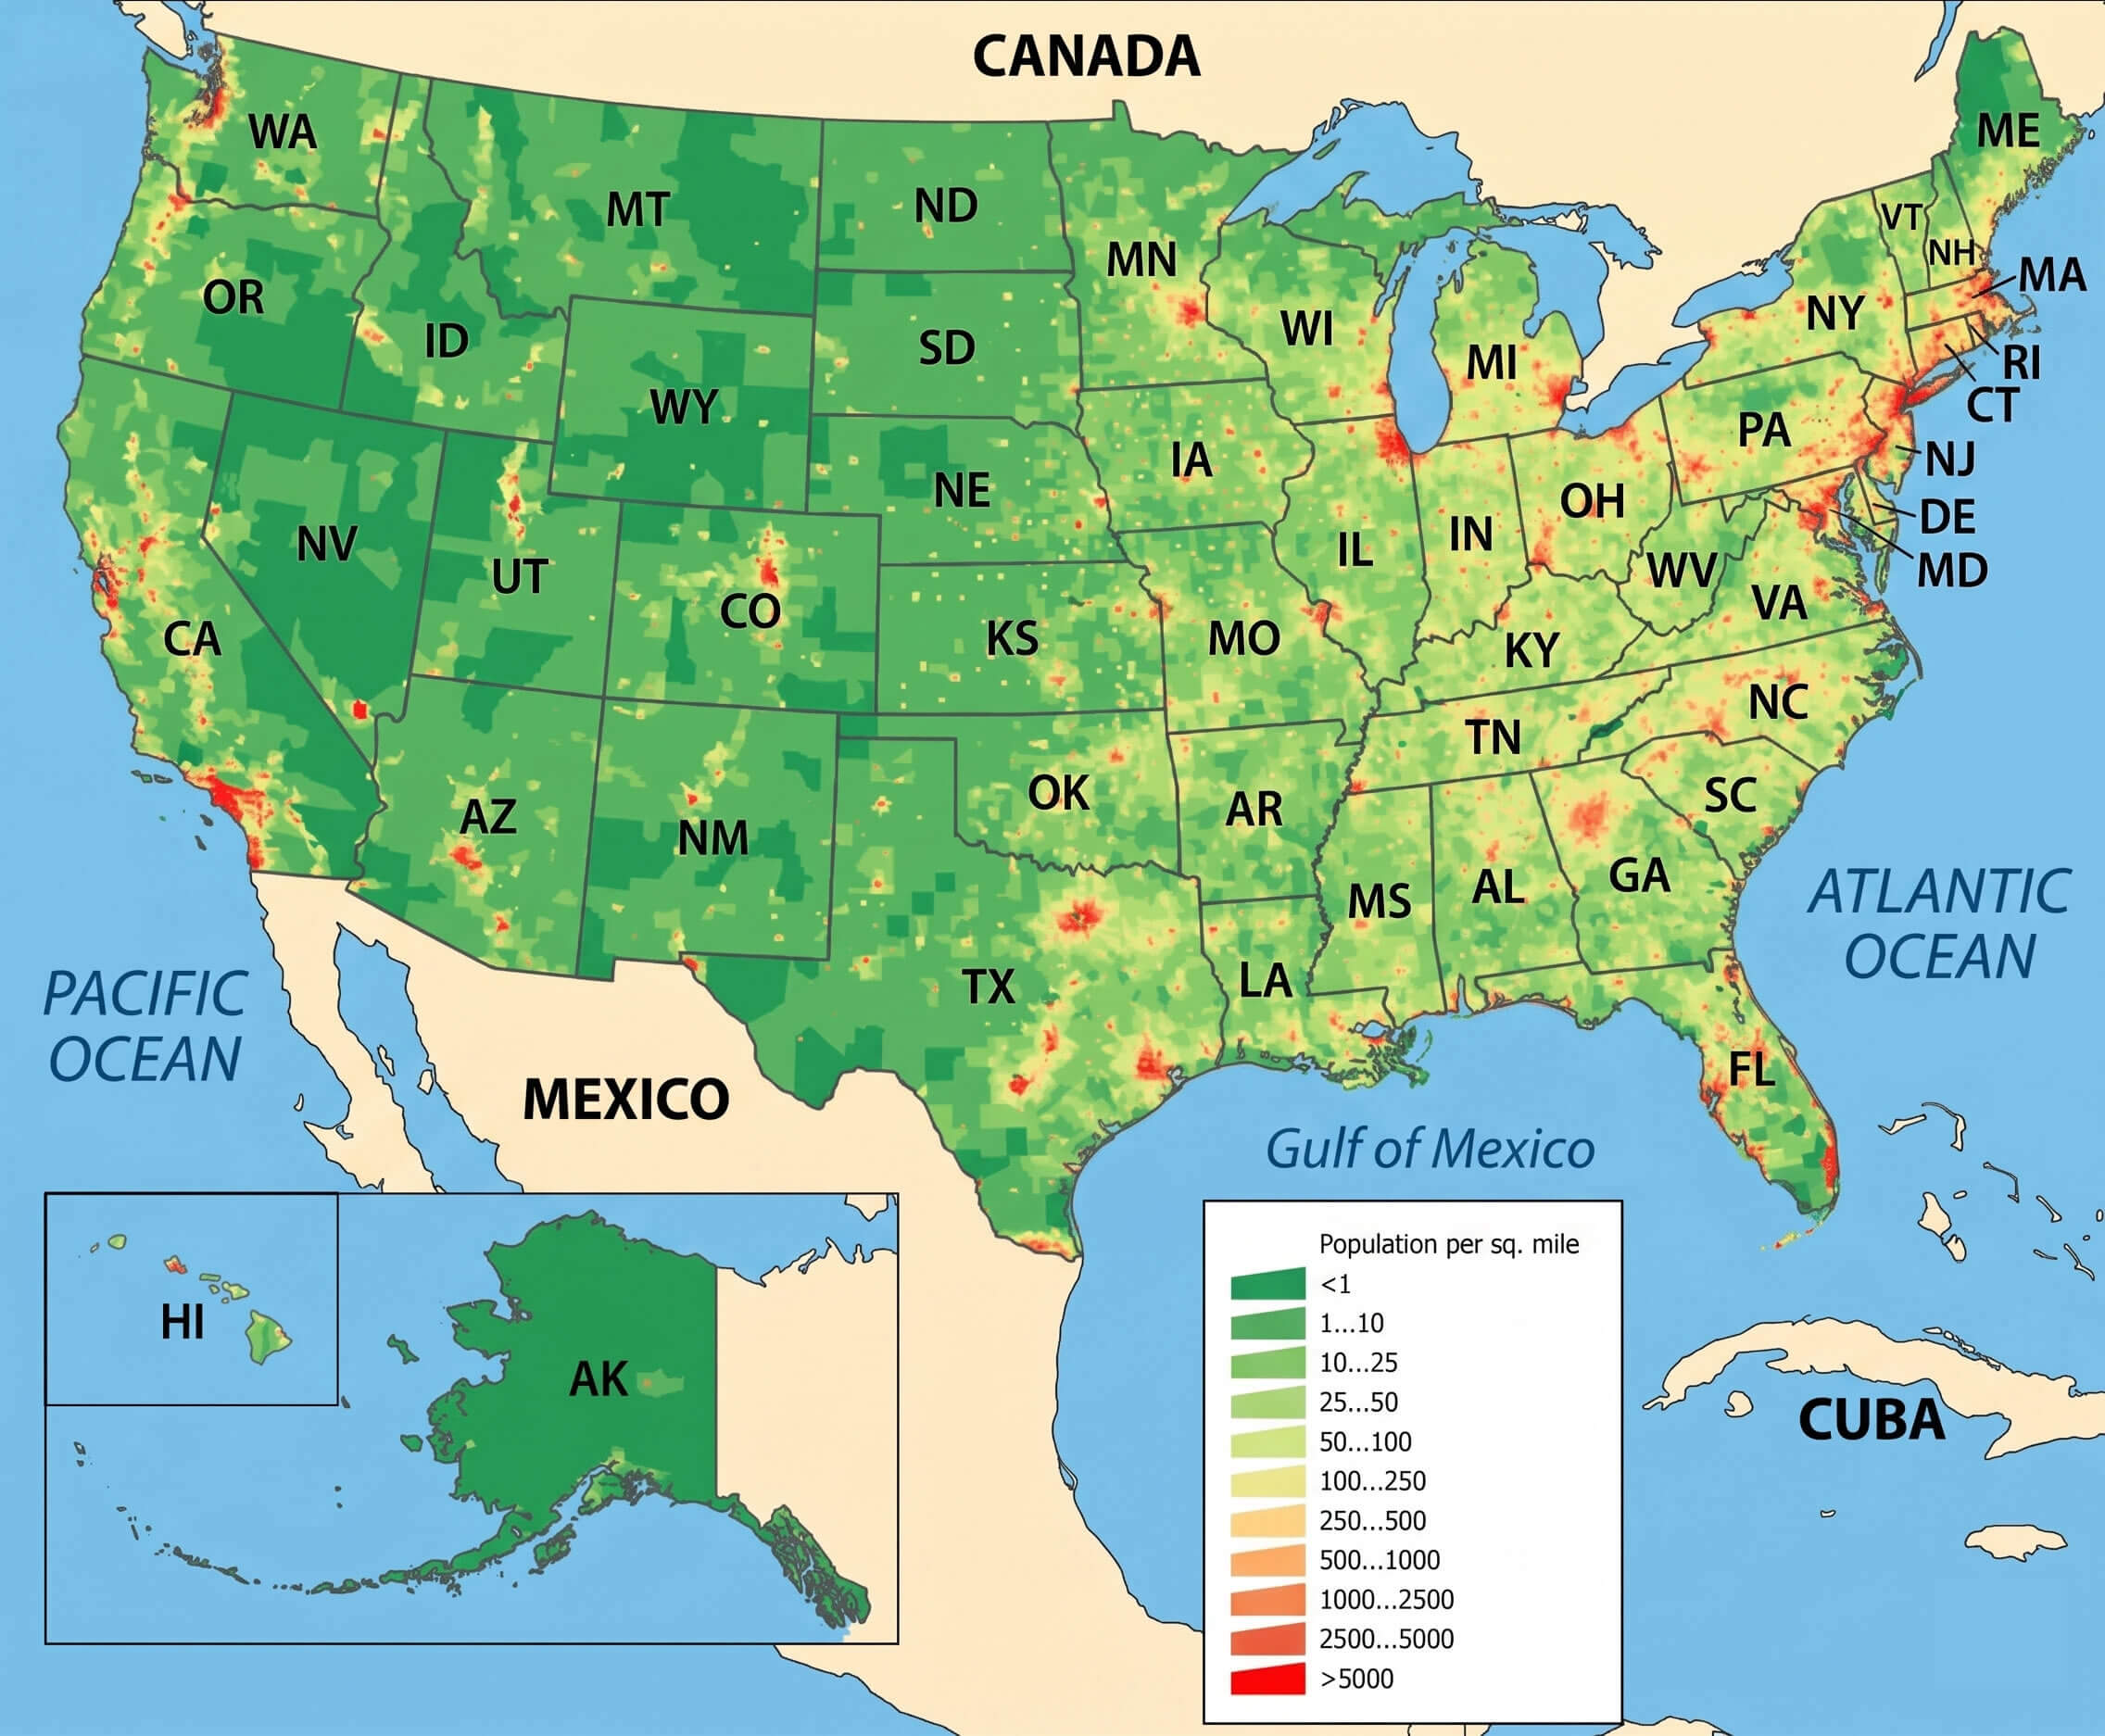
US Population Density Map
U.S. County Population Density Map

U.S. County Population Density Map
State Population Density Usa | Population Density By State 2024 – BZLU
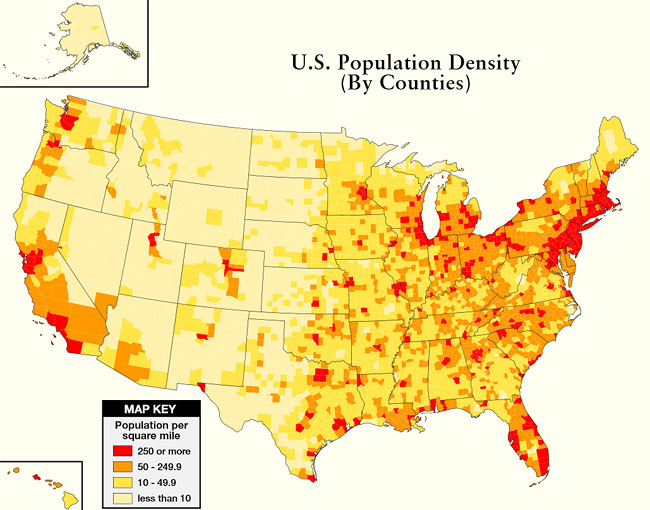
State Population Density Usa | Population Density By State 2024 – BZLU
United States Population Density Map 2022

United States Population Density Map 2022
Top 25 States By Population At Ronald Caster Blog

Top 25 States By Population at Ronald Caster blog
US Population Density Map
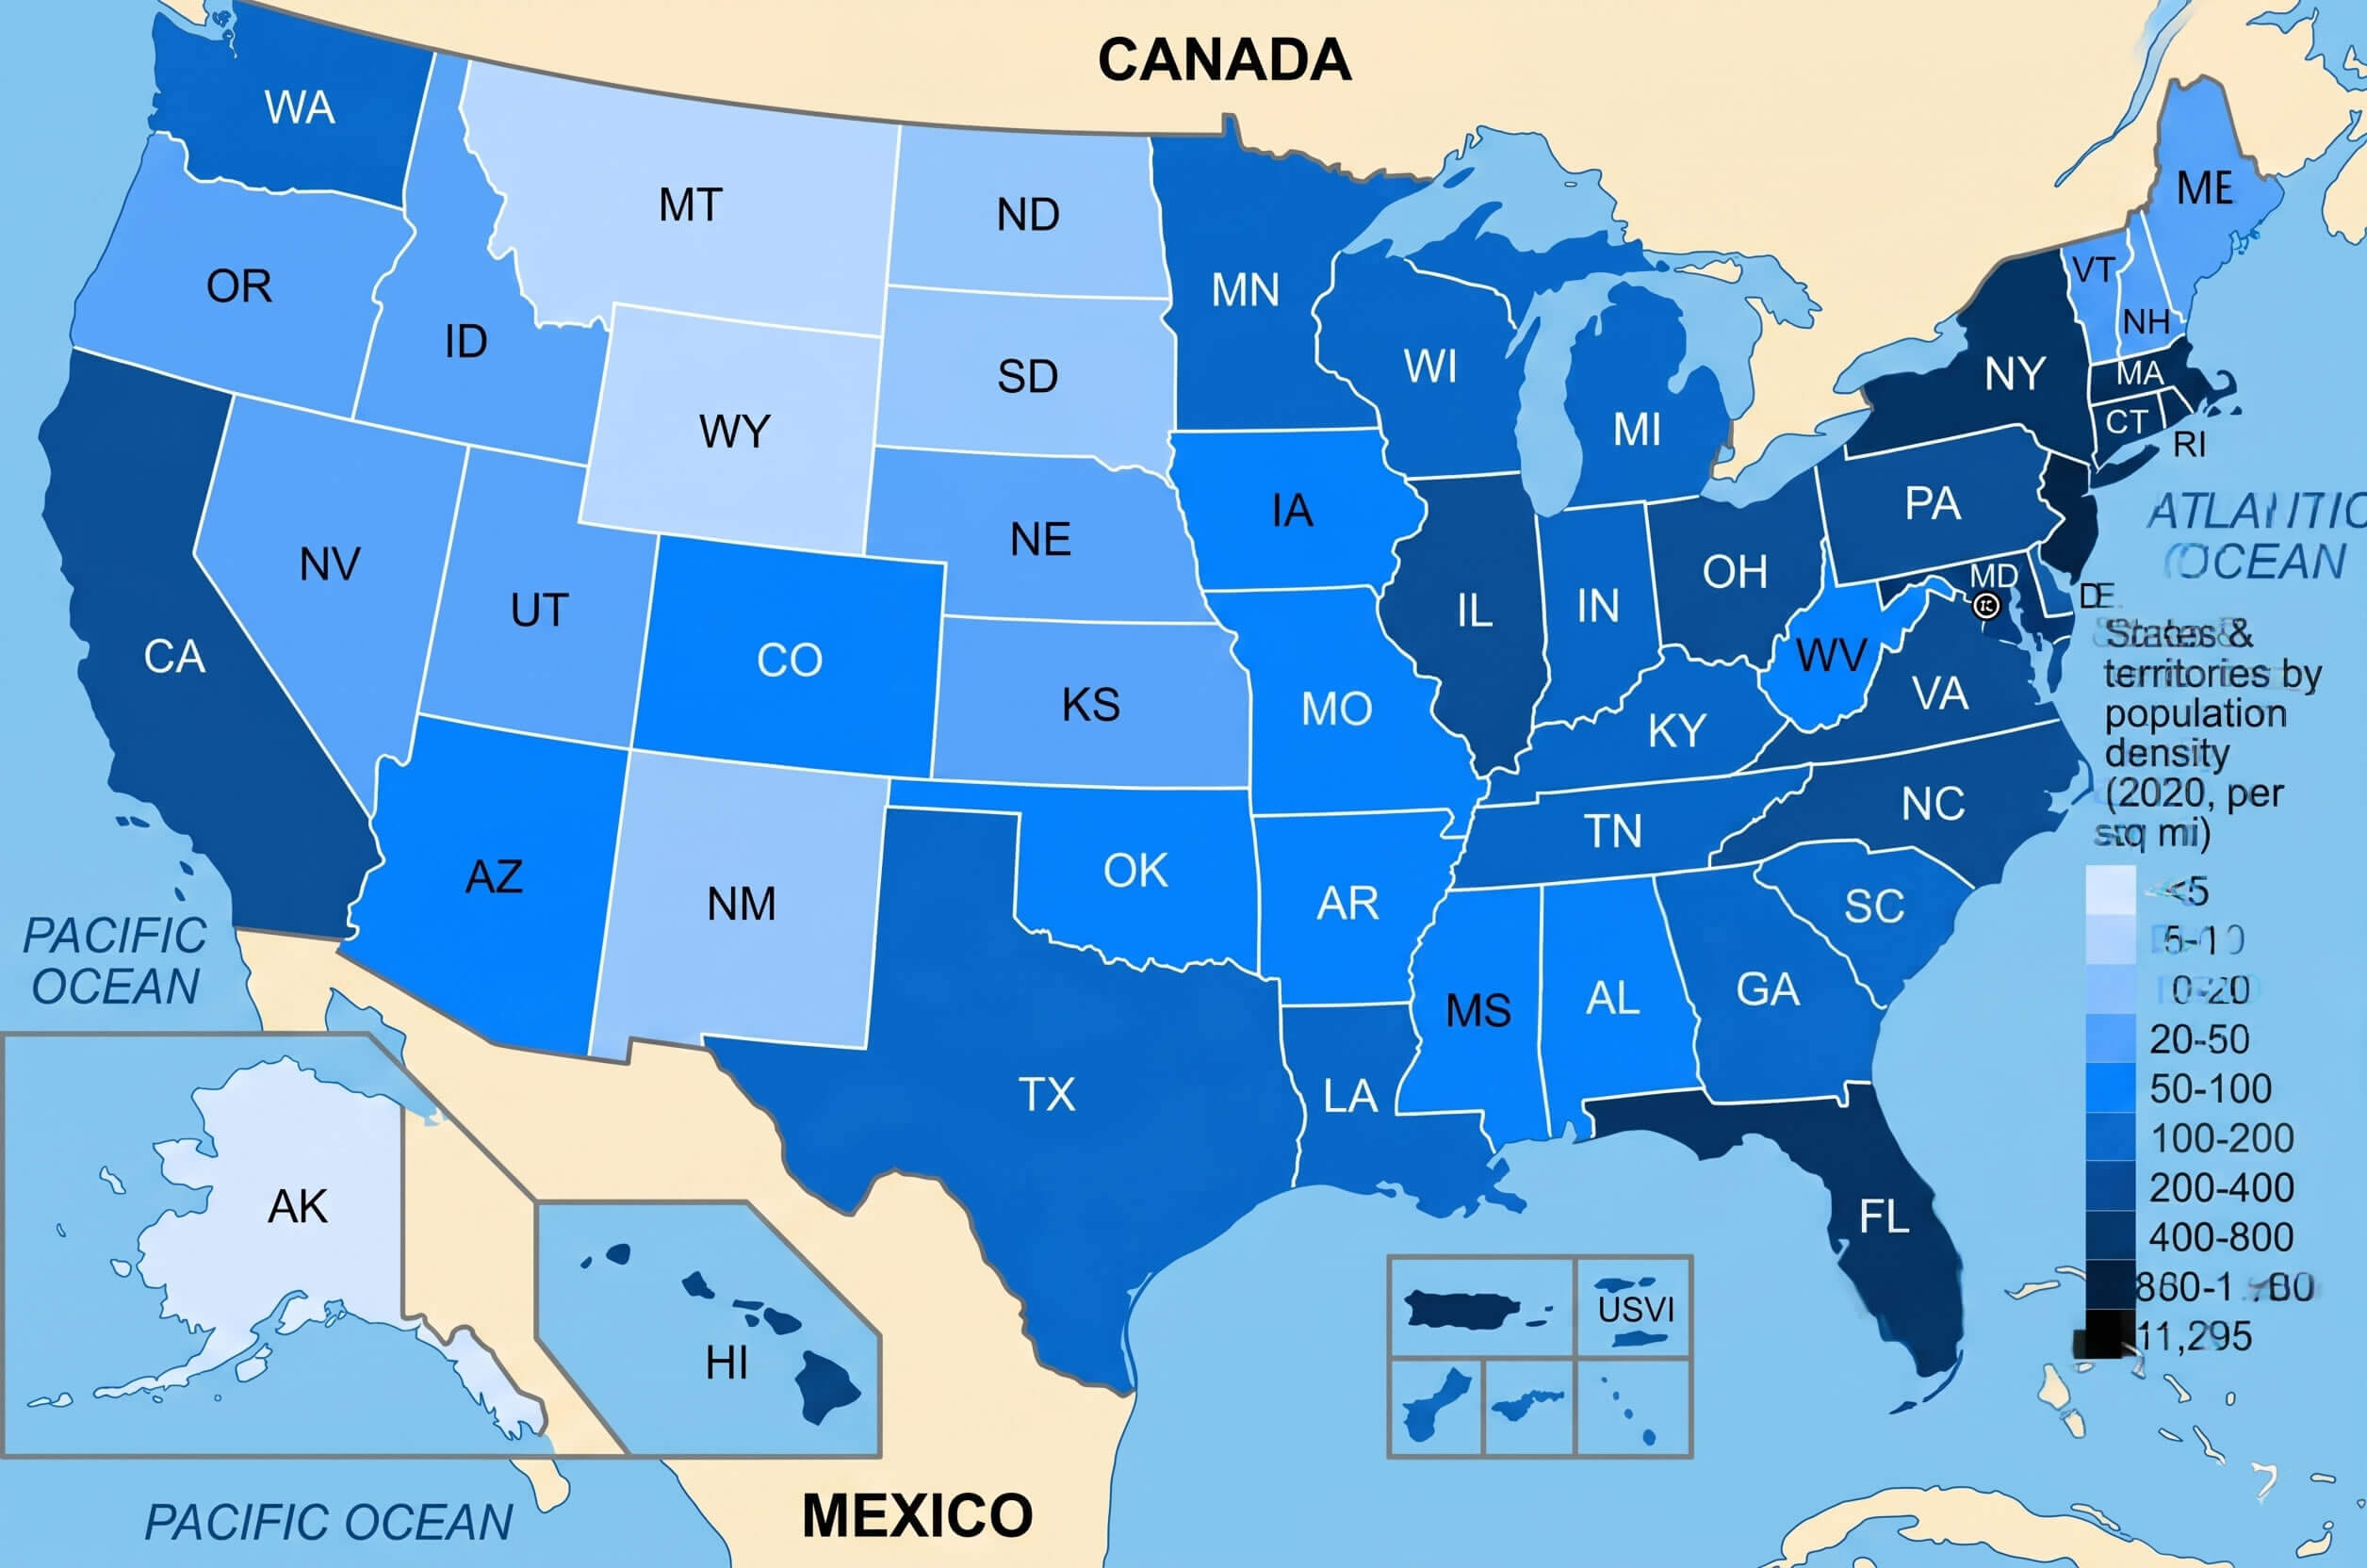
US Population Density Map
Top 25 States By Population At Ronald Caster Blog

Top 25 States By Population at Ronald Caster blog
Us County Map By Population Missouri County Map And Population List In

Us County Map By Population Missouri County Map And Population List In
Population Density By State | People Per Sq Mi

Population Density by State | People per Sq Mi
Map Of United States Population Density — Gridgrab

map of united states population density — Gridgrab
United States Population Density Map

United States Population Density Map
States Ranked By Population Density – GCDJ

States Ranked By Population Density – GCDJ
Population Density Map Of USA 2025

Population Density Map of USA 2025
USA Population Density Map | Printable Map Of USA
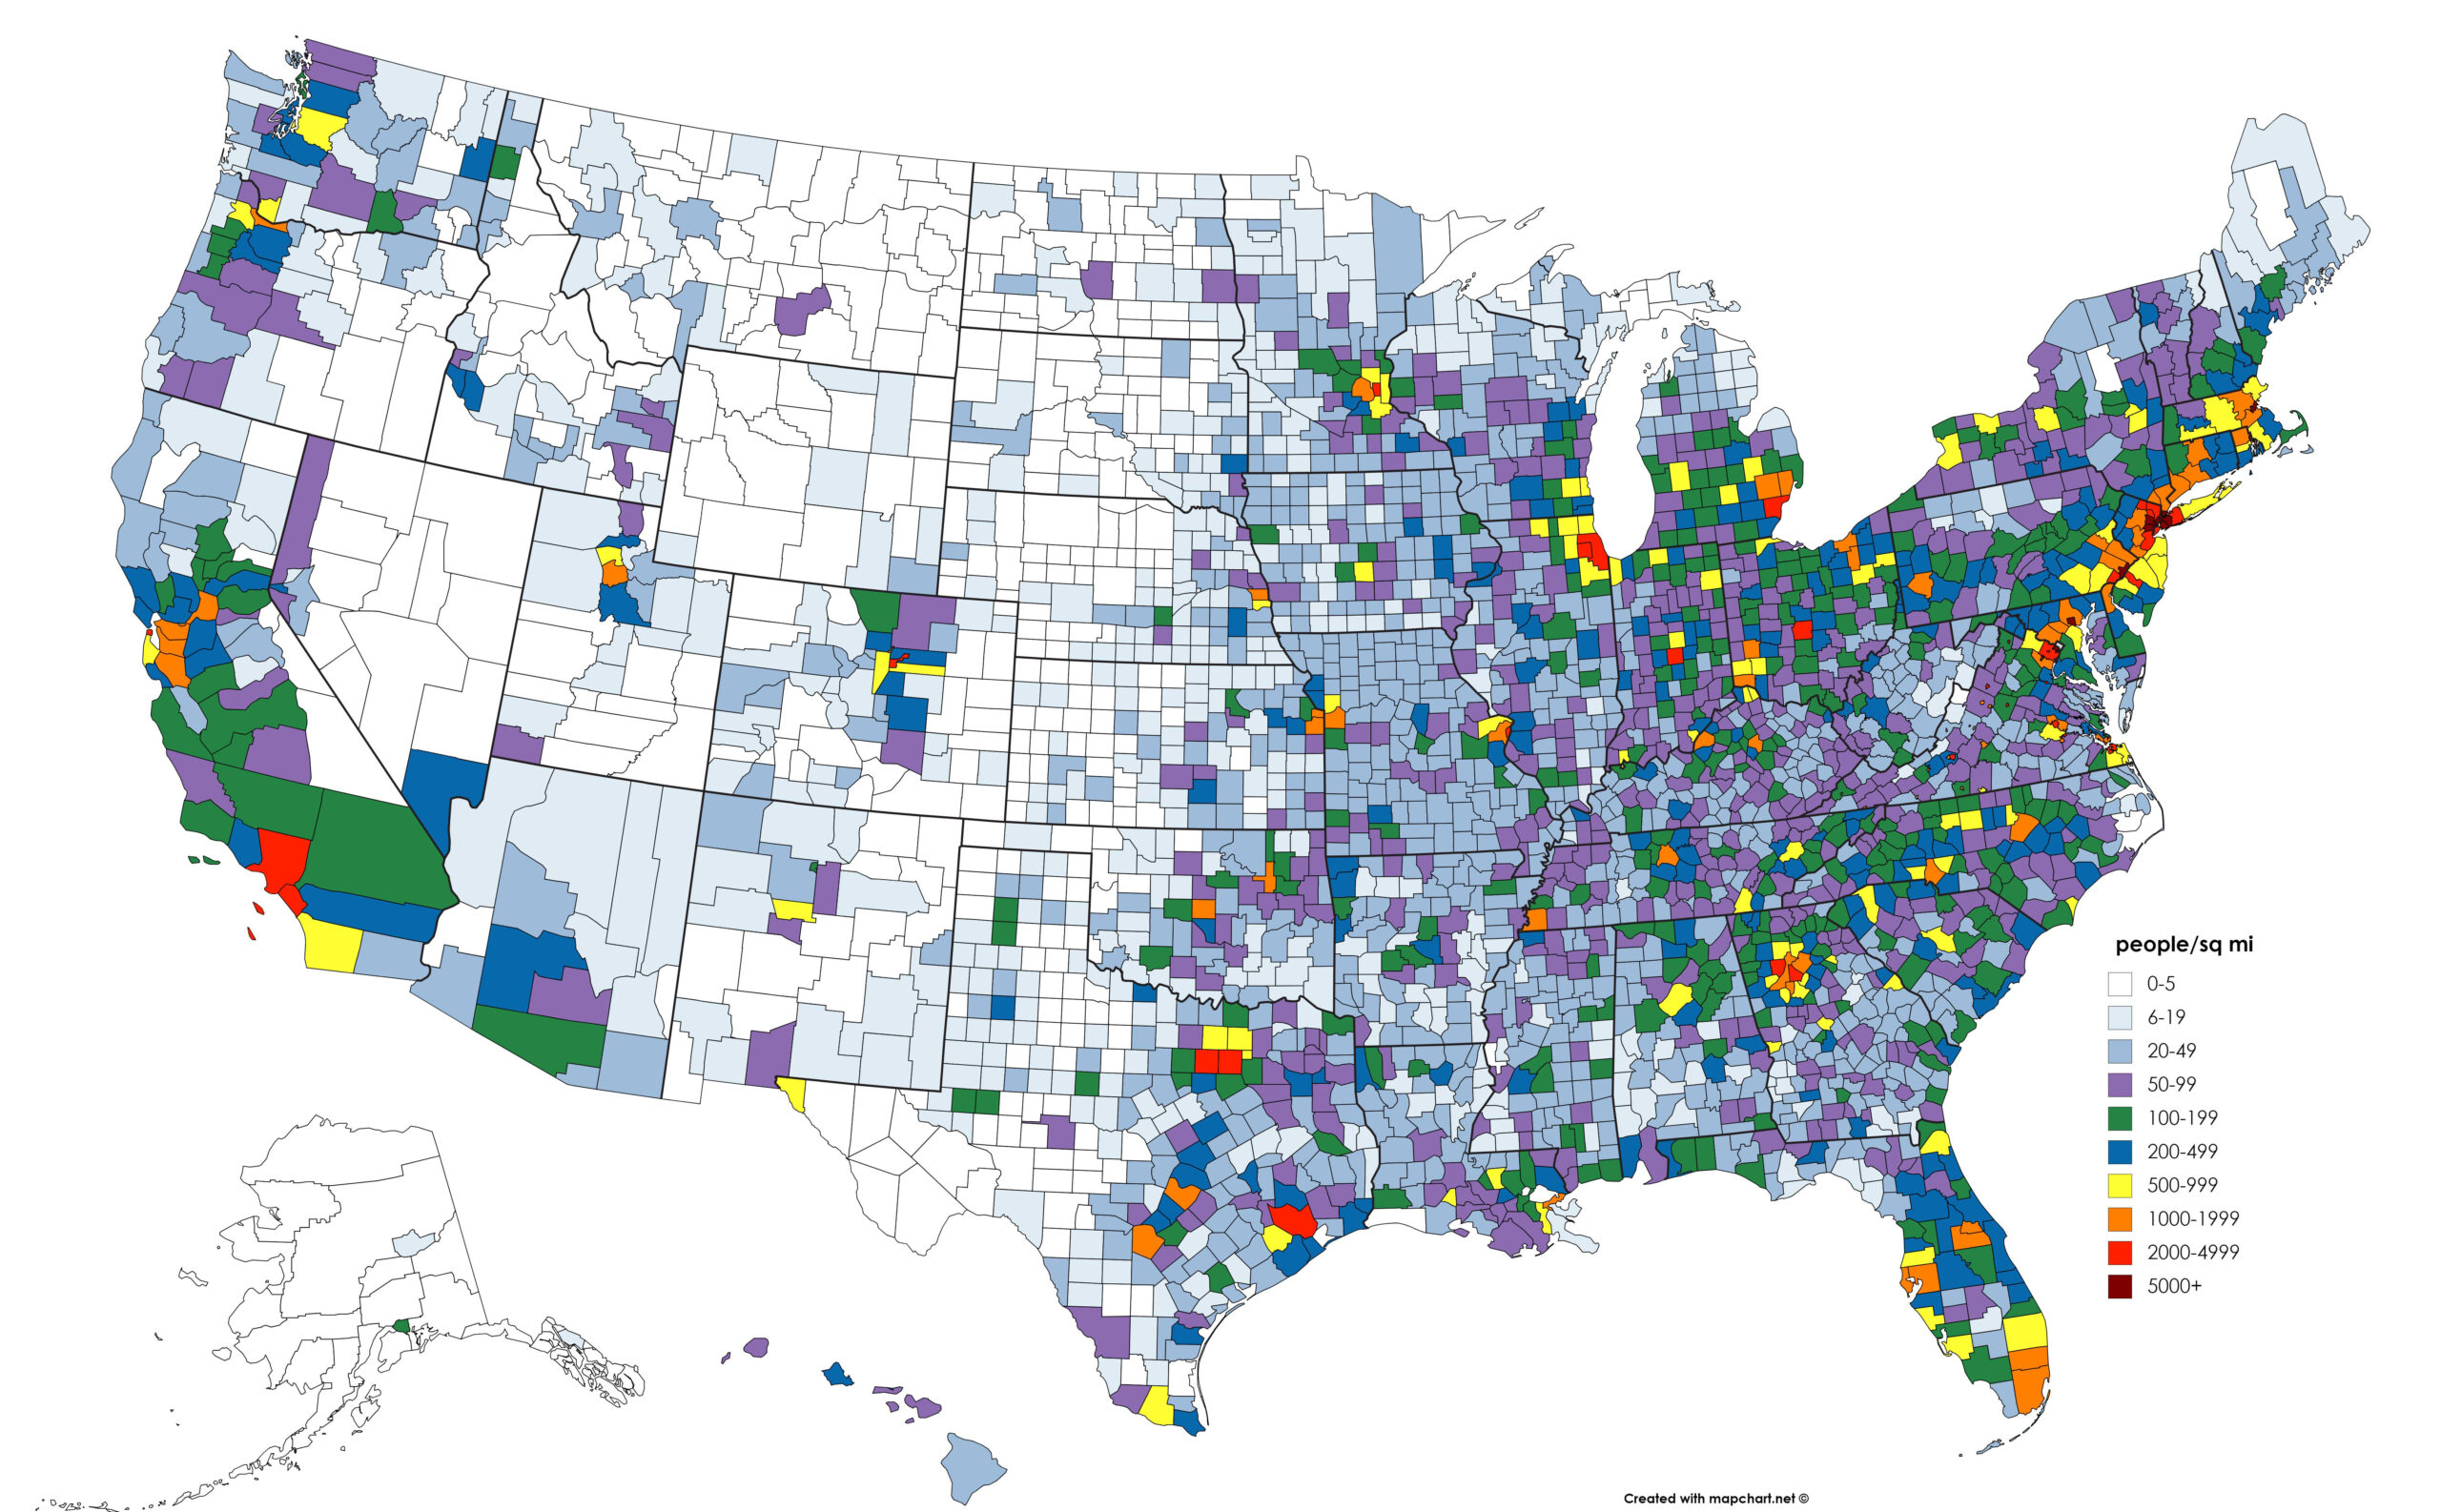
USA Population Density Map | Printable Map Of USA
Population Density Map Usa 2025 – ATCYE
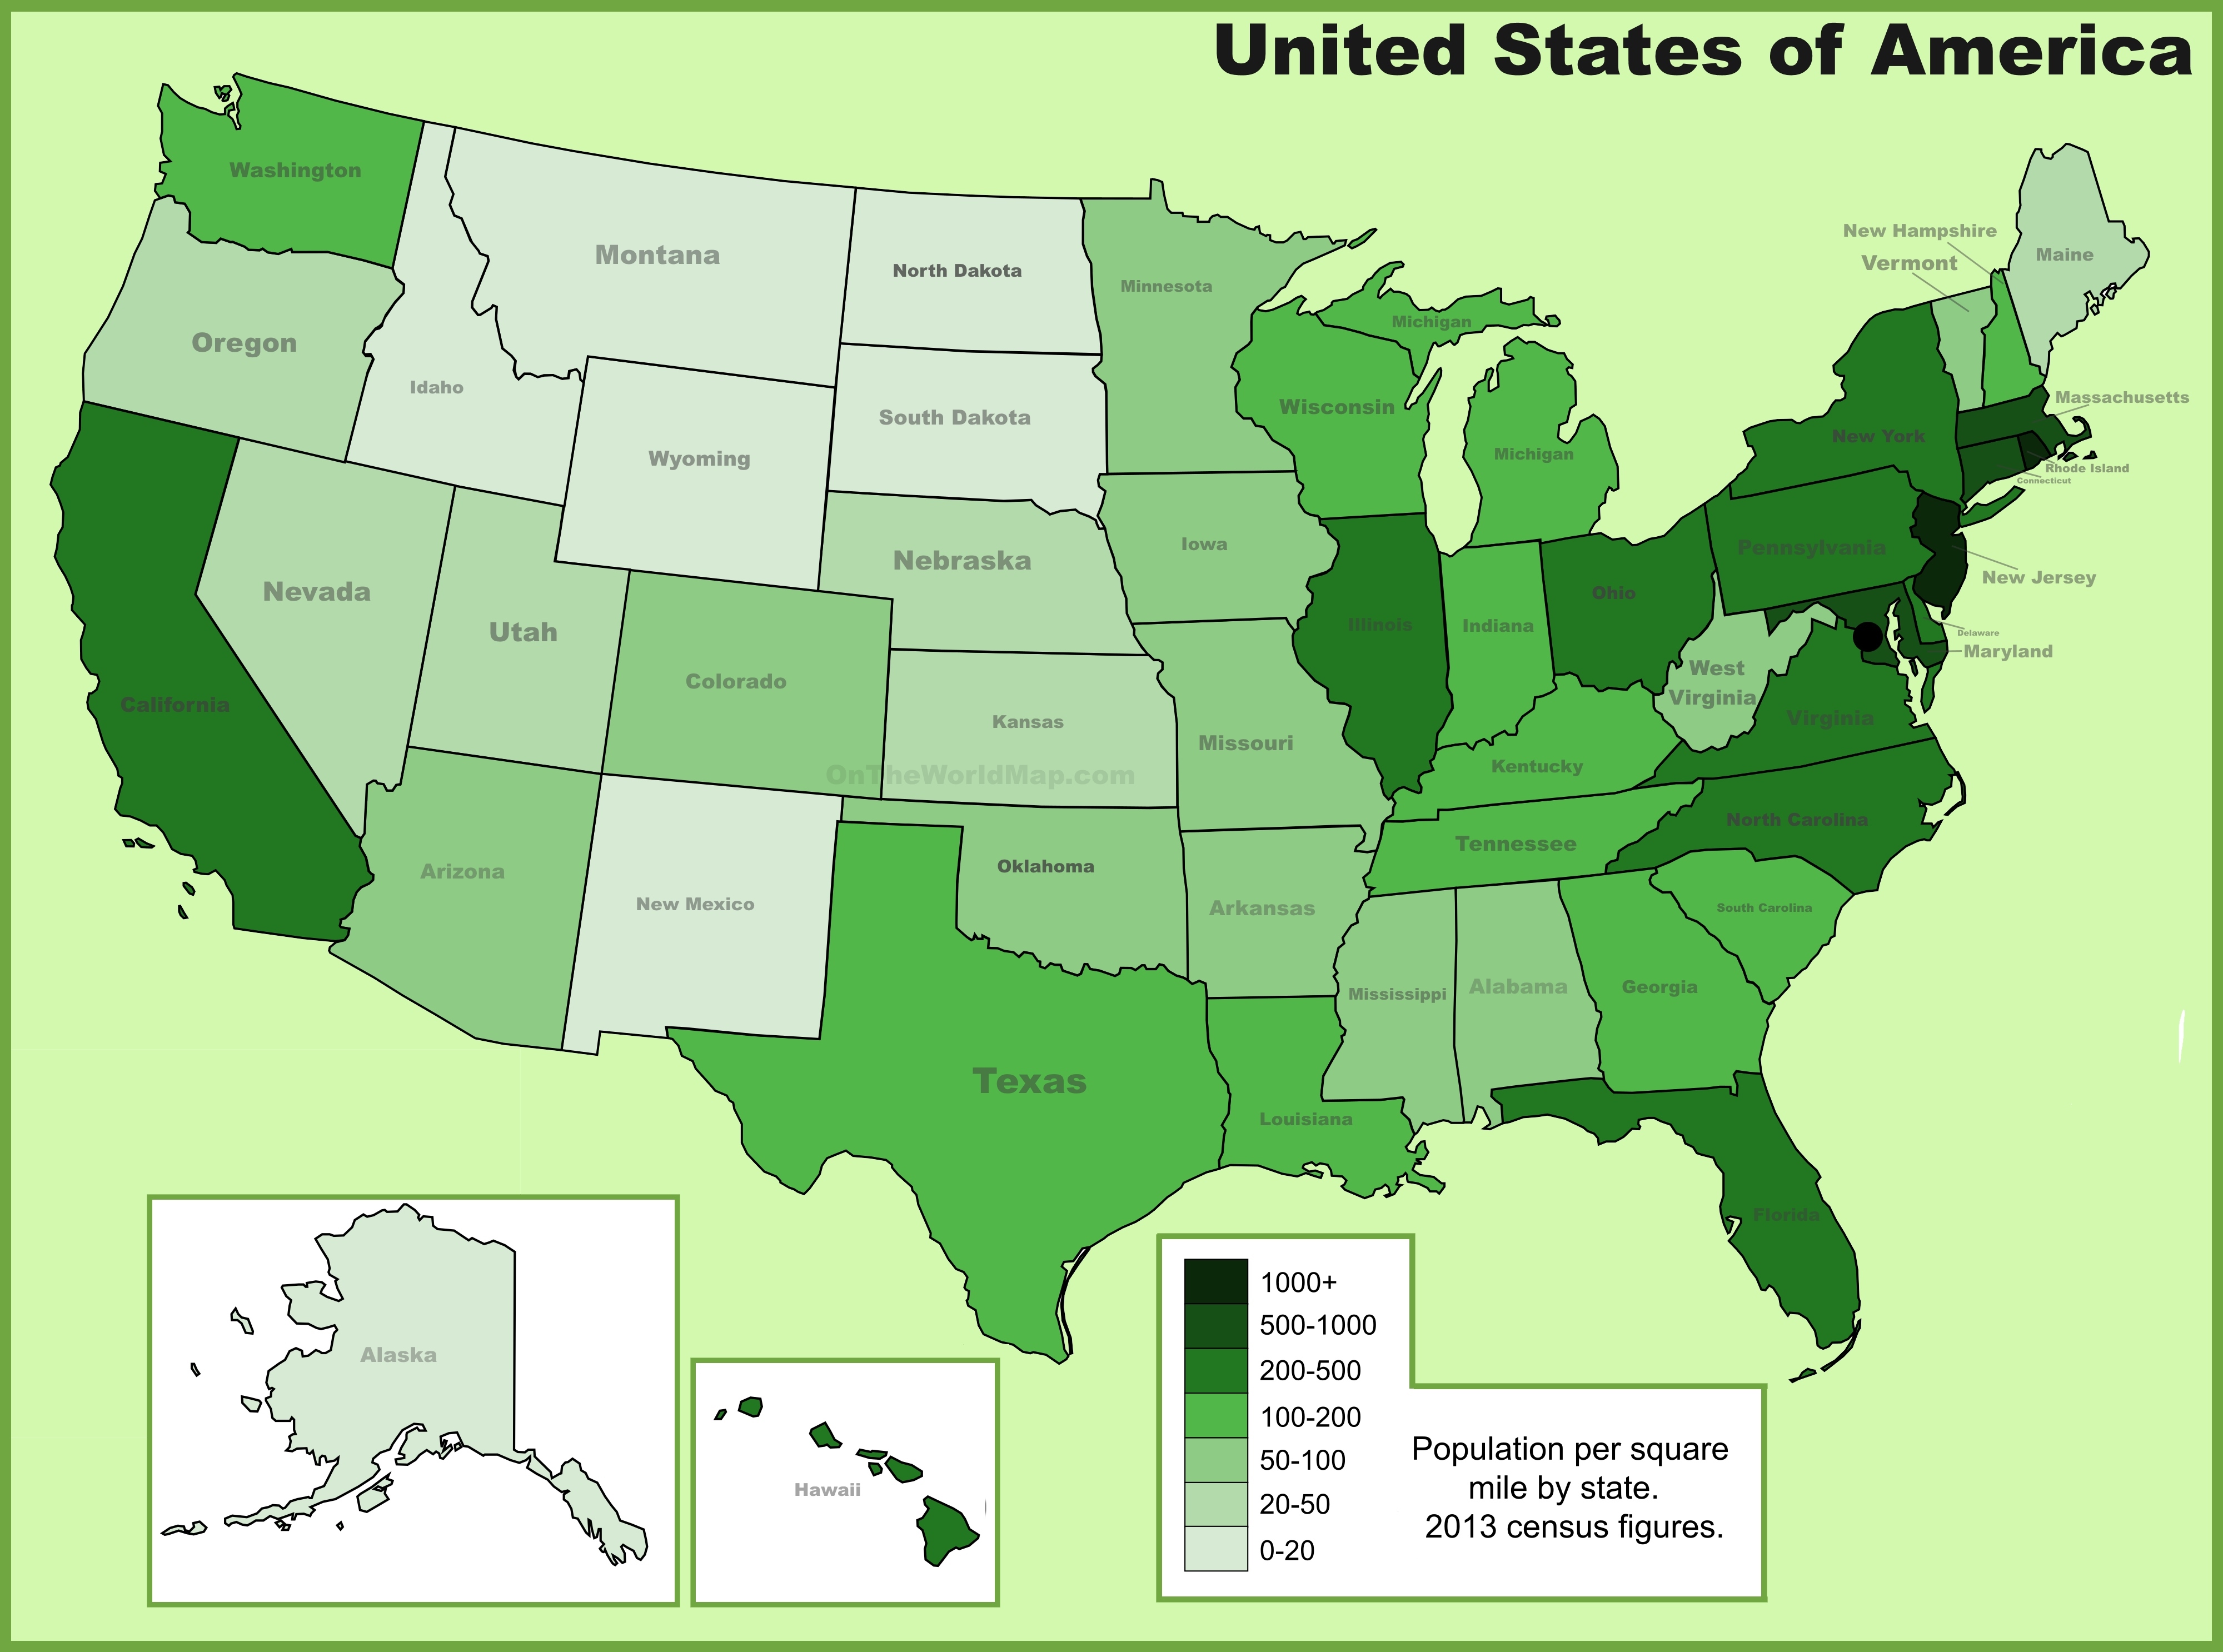
Population Density Map Usa 2025 – ATCYE
US Population Density Map
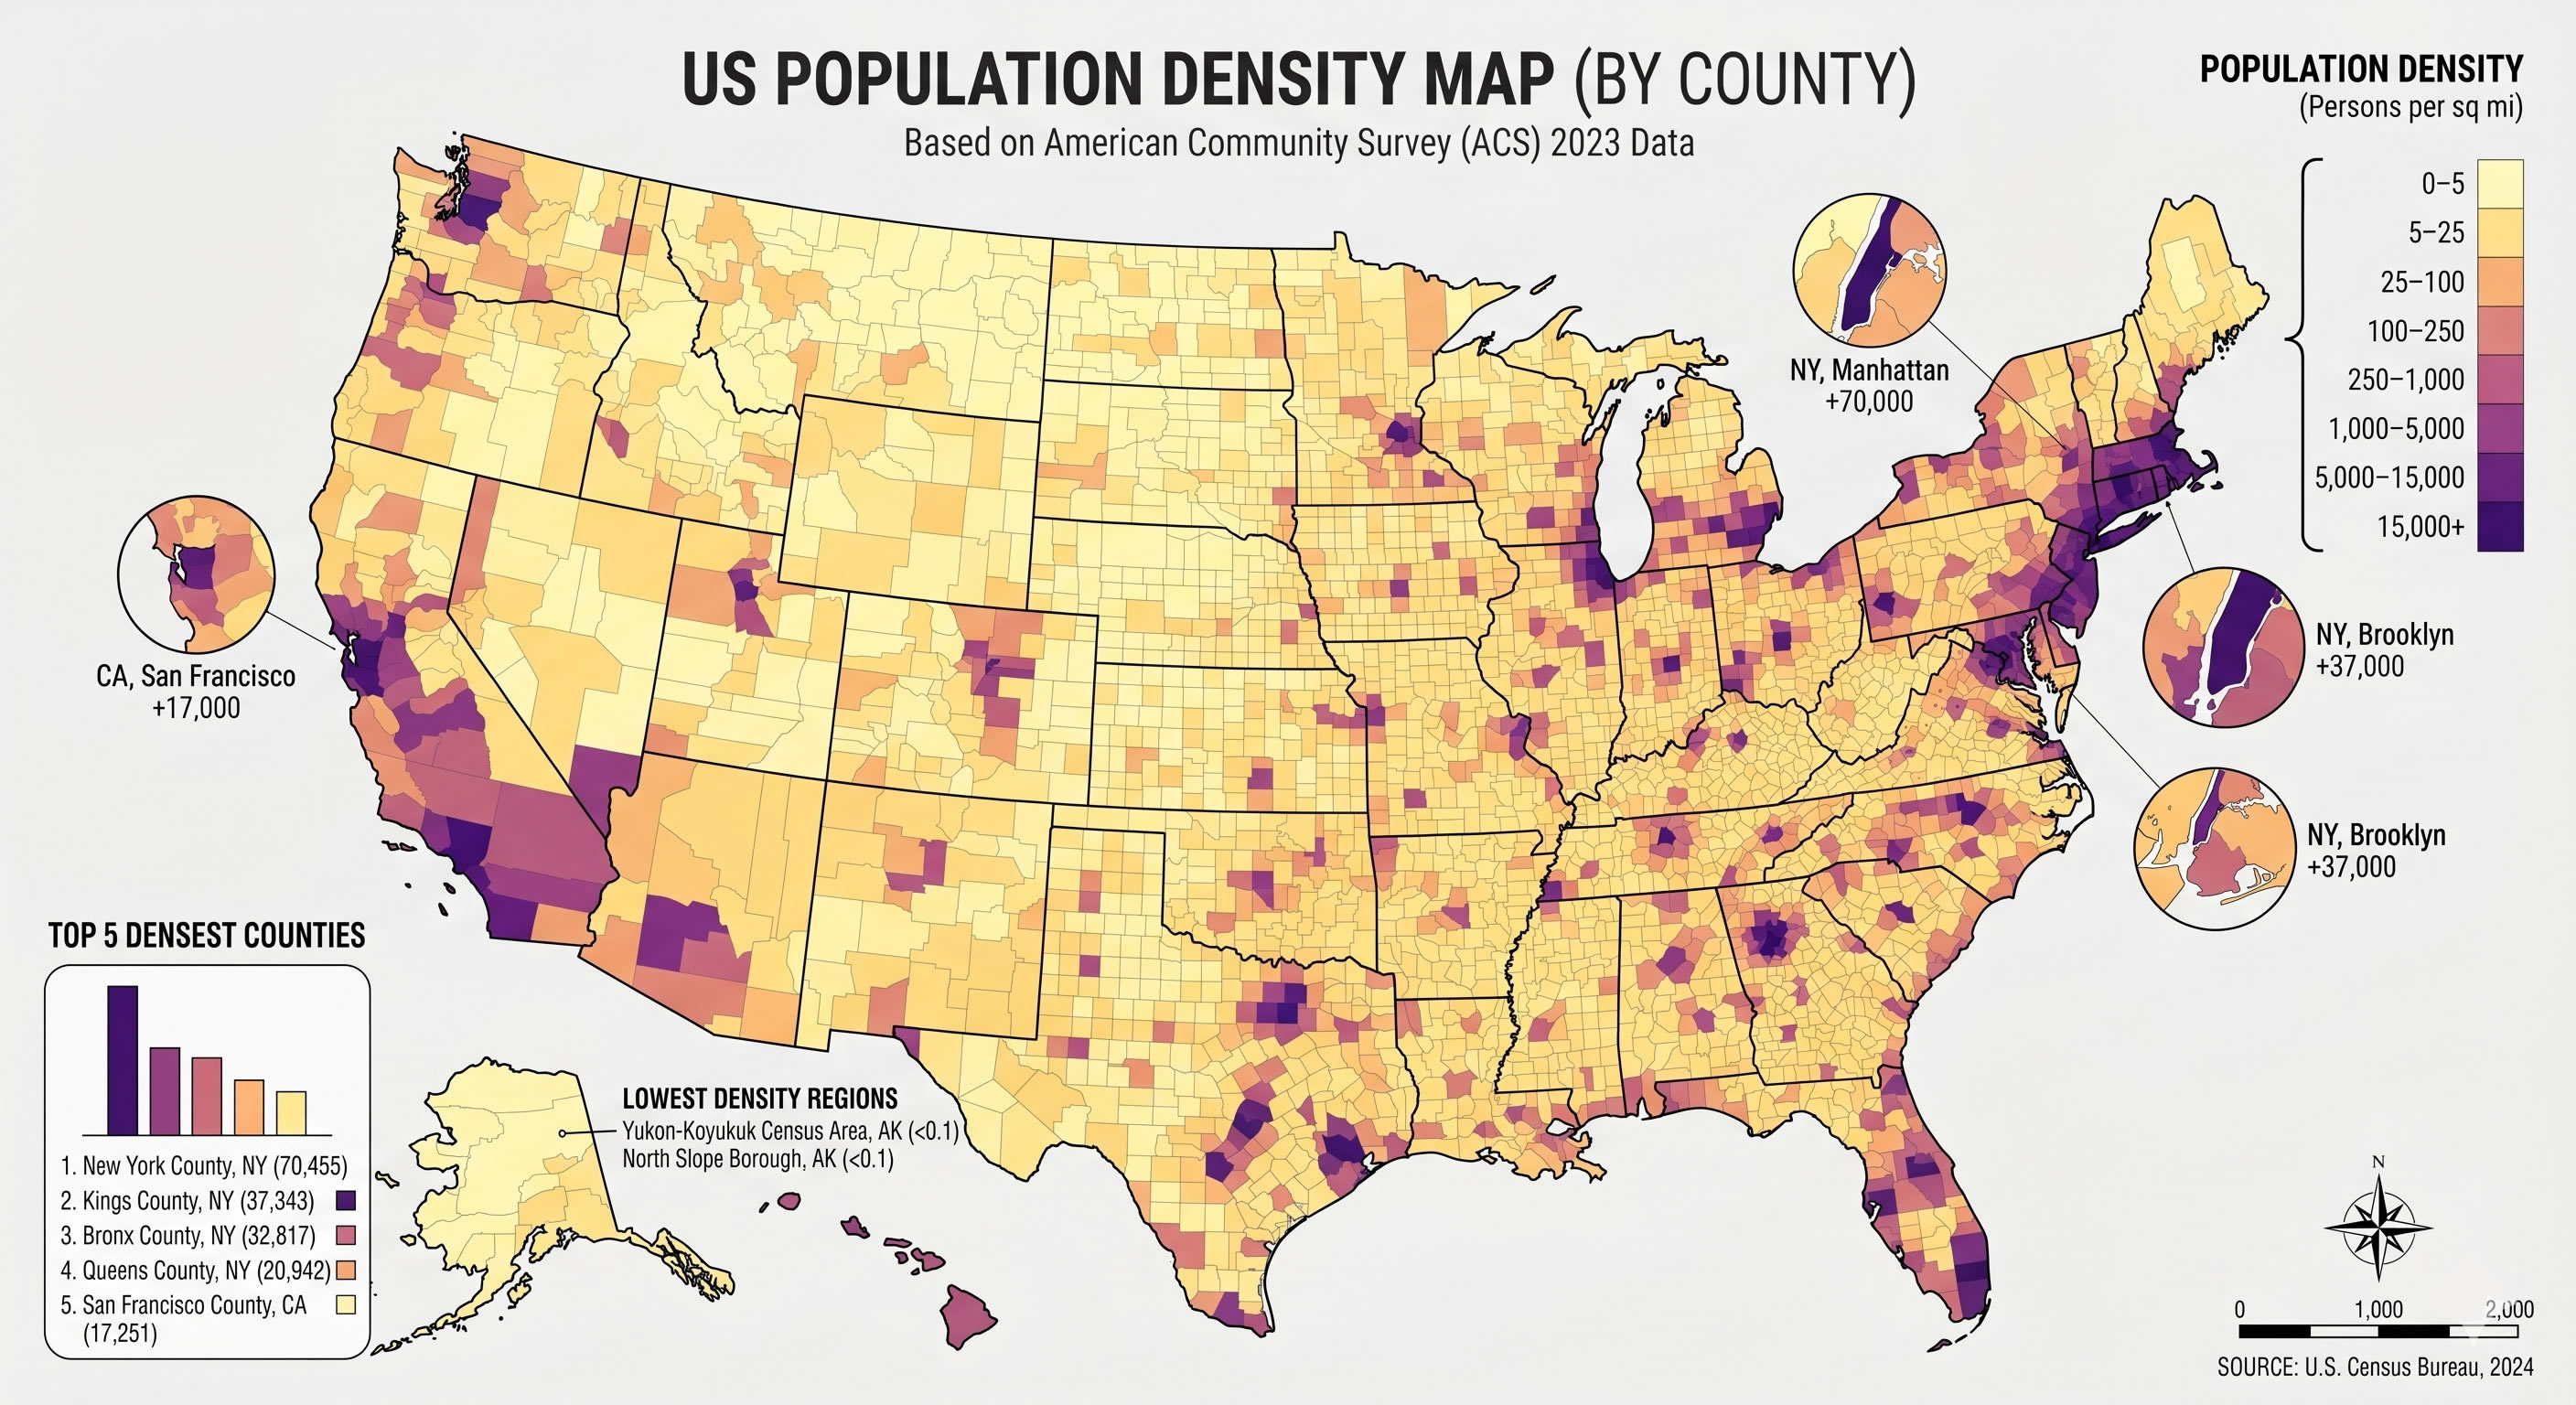
US Population Density Map
Population Density In The United States By State [OC] : R/MapPorn
Population density in the United States by state [OC] : r/MapPorn
United States Population Density Map
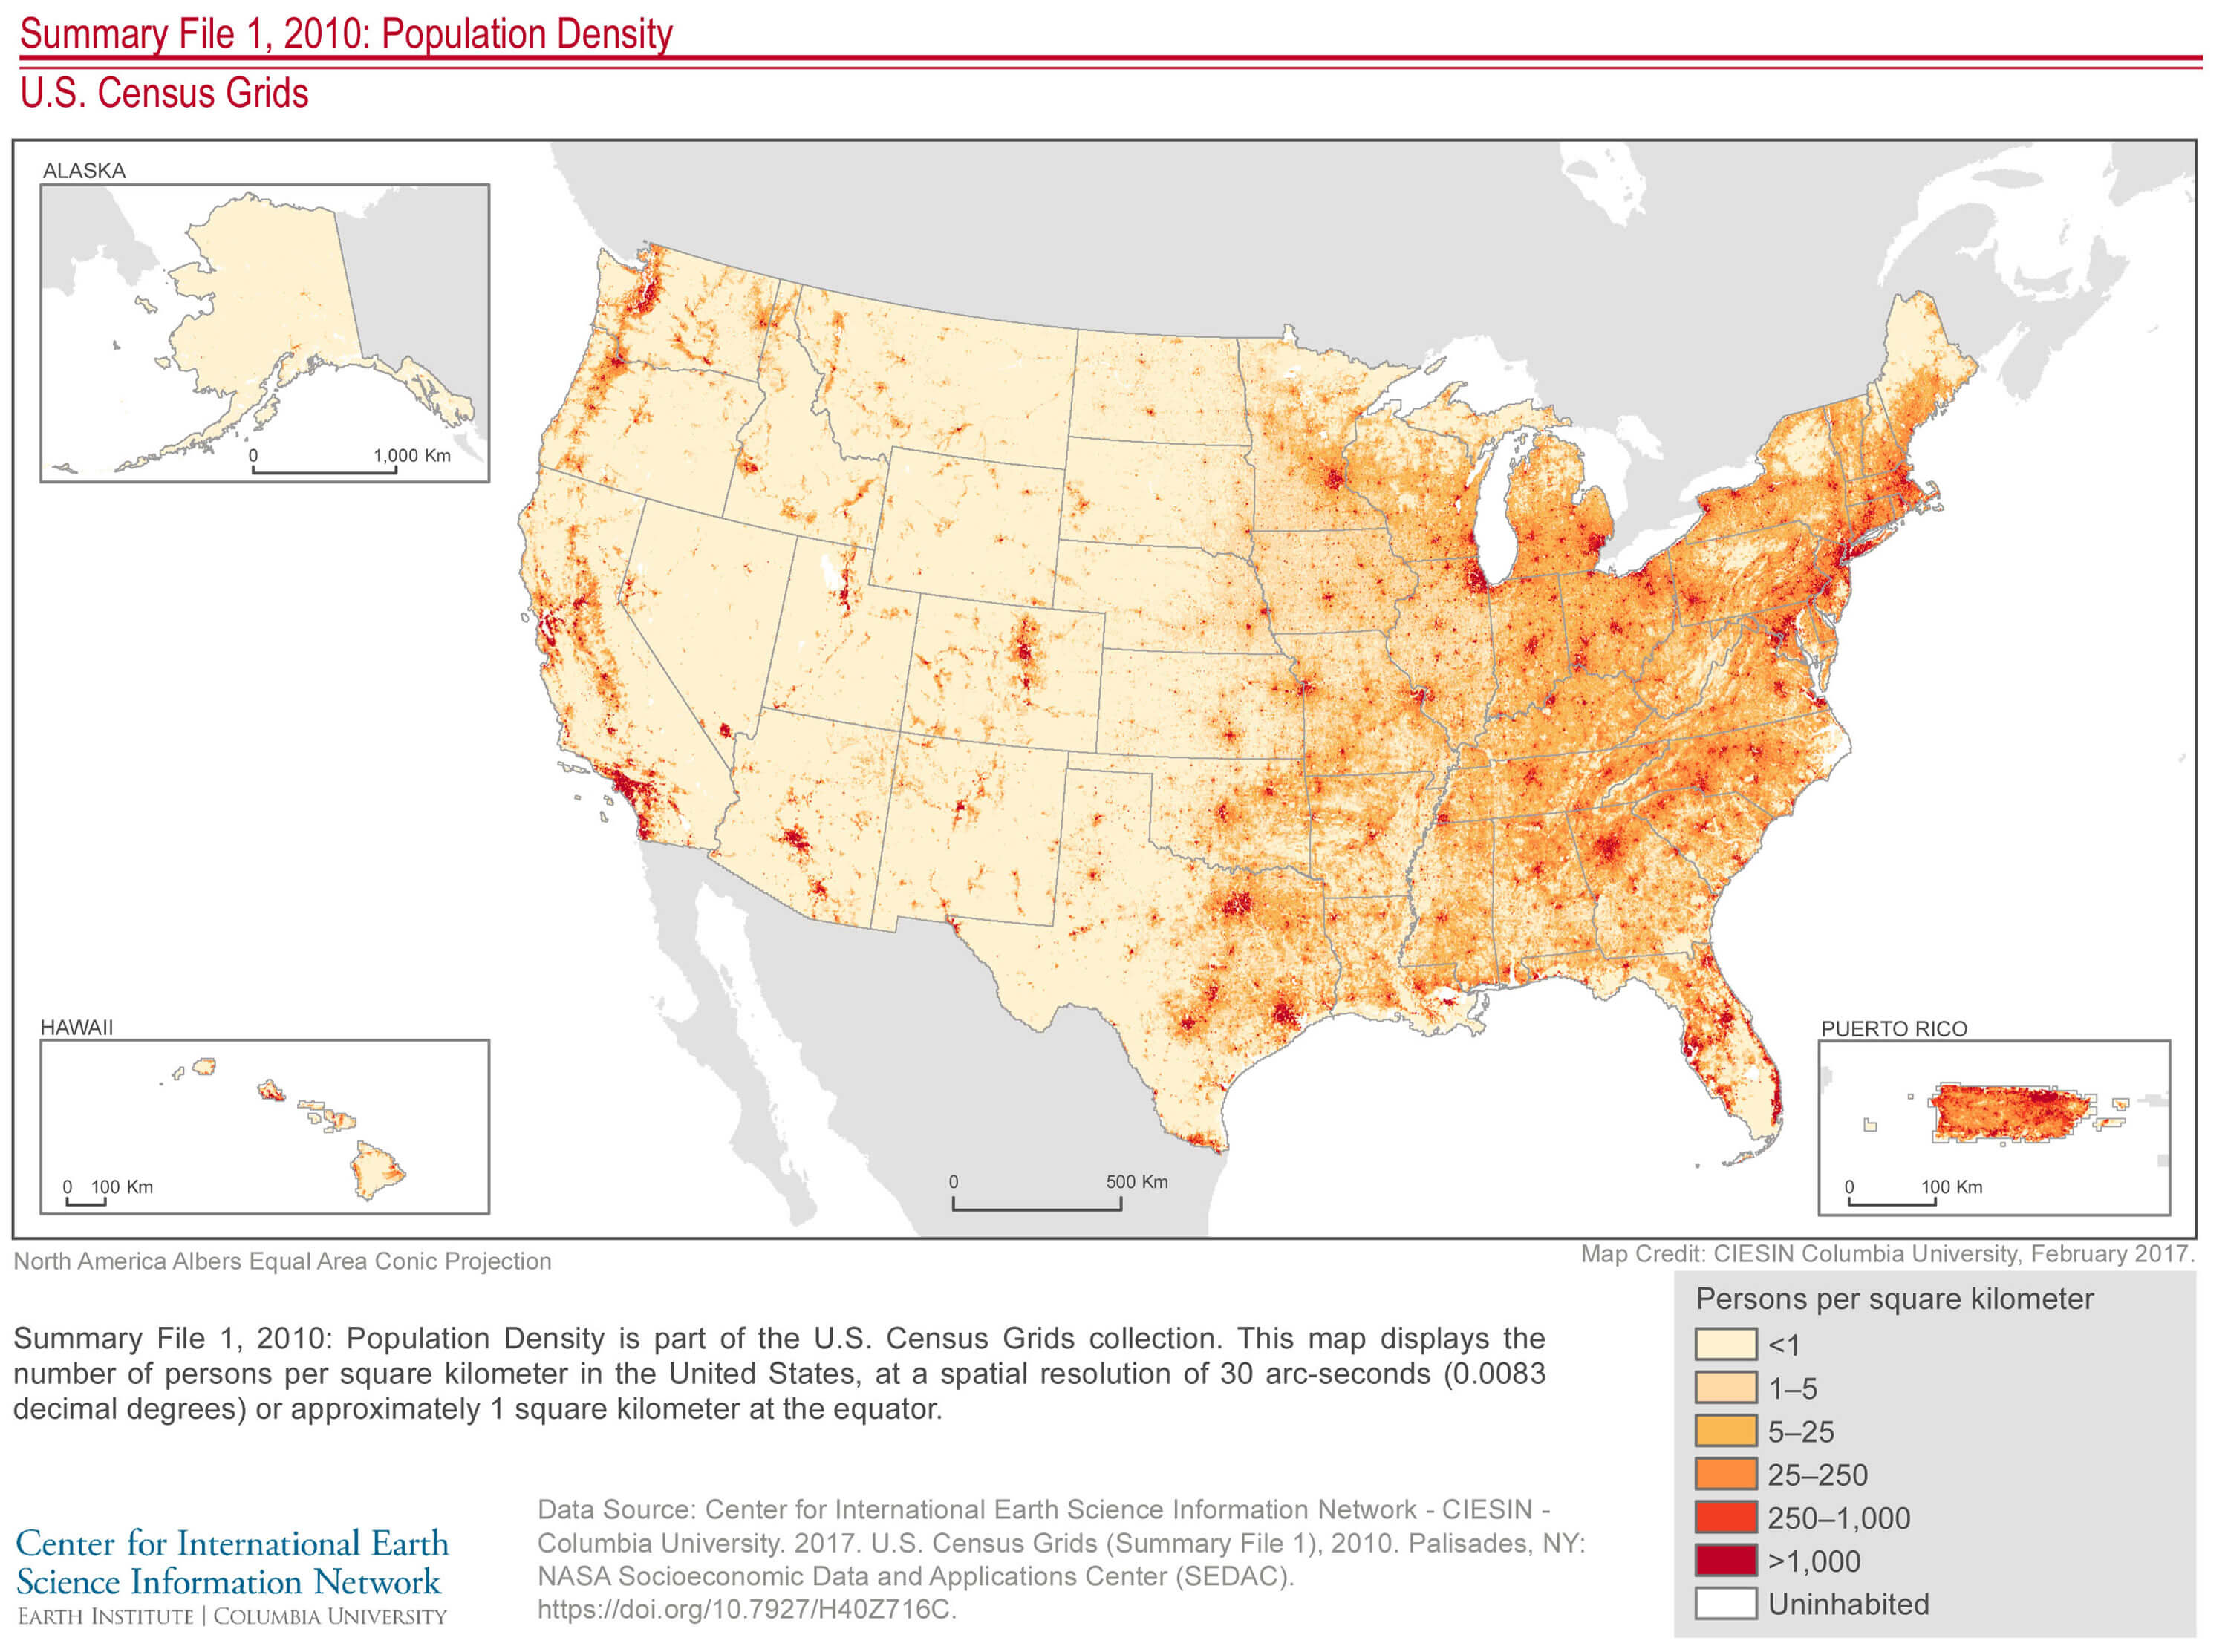
United States Population Density Map
Us Population Density Map 2020 - Pdffeet

Us population density map 2020 - pdffeet
U.S. Population Density Map | Map, United States Map, Human Geography

U.S. Population Density Map | Map, United states map, Human geography
United States Population Map What Does The US Population Density Looks

United States Population Map What Does The US Population Density Looks
