U.S. Population Density Map Reveals Stark Regional Disparities
The latest U.S. population density map, released by Vivid Maps, illustrates significant regional concentration of residents, with major metropolitan areas such as New York, Los Angeles, and Chicago displaying densities exceeding 10,000 persons per square mile. In contrast, large swaths of the Midwest, the Great Plains, and the Southwest remain sparsely populated, often below 200 persons per square mile. These disparities underscore ongoing challenges in infrastructure planning, resource allocation, and political representation.
Context
Population density has long been a critical metric for urban planners and policymakers. The 2021 map, sourced from the U.S. Census Bureau’s latest estimates, captures shifts since the 2010 Census, reflecting continued migration toward coastal cities and the rise of suburban hotspots. Rural depopulation, driven by aging demographics and limited economic opportunities, is evident across the central states. This pattern mirrors global urbanization trends, where 55% of the world’s population now lives in urban areas.

Details
The map’s color gradients range from light yellow for low-density zones to deep red for high-density concentrations. Key observations include: (1) The Northeast Corridor, stretching from Boston to Washington, D.C., maintains a continuous band of high density. (2) The Southern Plains and parts of Texas show moderate density spikes around major cities like Dallas, Houston, and Austin. (3) The Mountain West, particularly areas in Wyoming and Montana, remains some of the country’s lowest density regions, with fewer than 50 persons per square mile.

Implications
The pronounced density gradients carry several implications for national policy. High-density regions face intensified demand for public transit, affordable housing, and broadband infrastructure, while low-density areas grapple with service delivery costs and school district consolidation. Moreover, political representation is increasingly skewed, with urban voters wielding greater influence in national elections, prompting debates over gerrymandering and equal vote weight. Environmental concerns also arise, as concentrated populations contribute to higher carbon footprints, yet may benefit from more efficient public services. Conversely, rural sparsity can preserve natural landscapes but struggles to attract investment.
Understanding these density patterns is essential for stakeholders seeking balanced growth, equitable resource distribution, and sustainable development across the United States.
USA Population Density Map | Printable Map Of USA
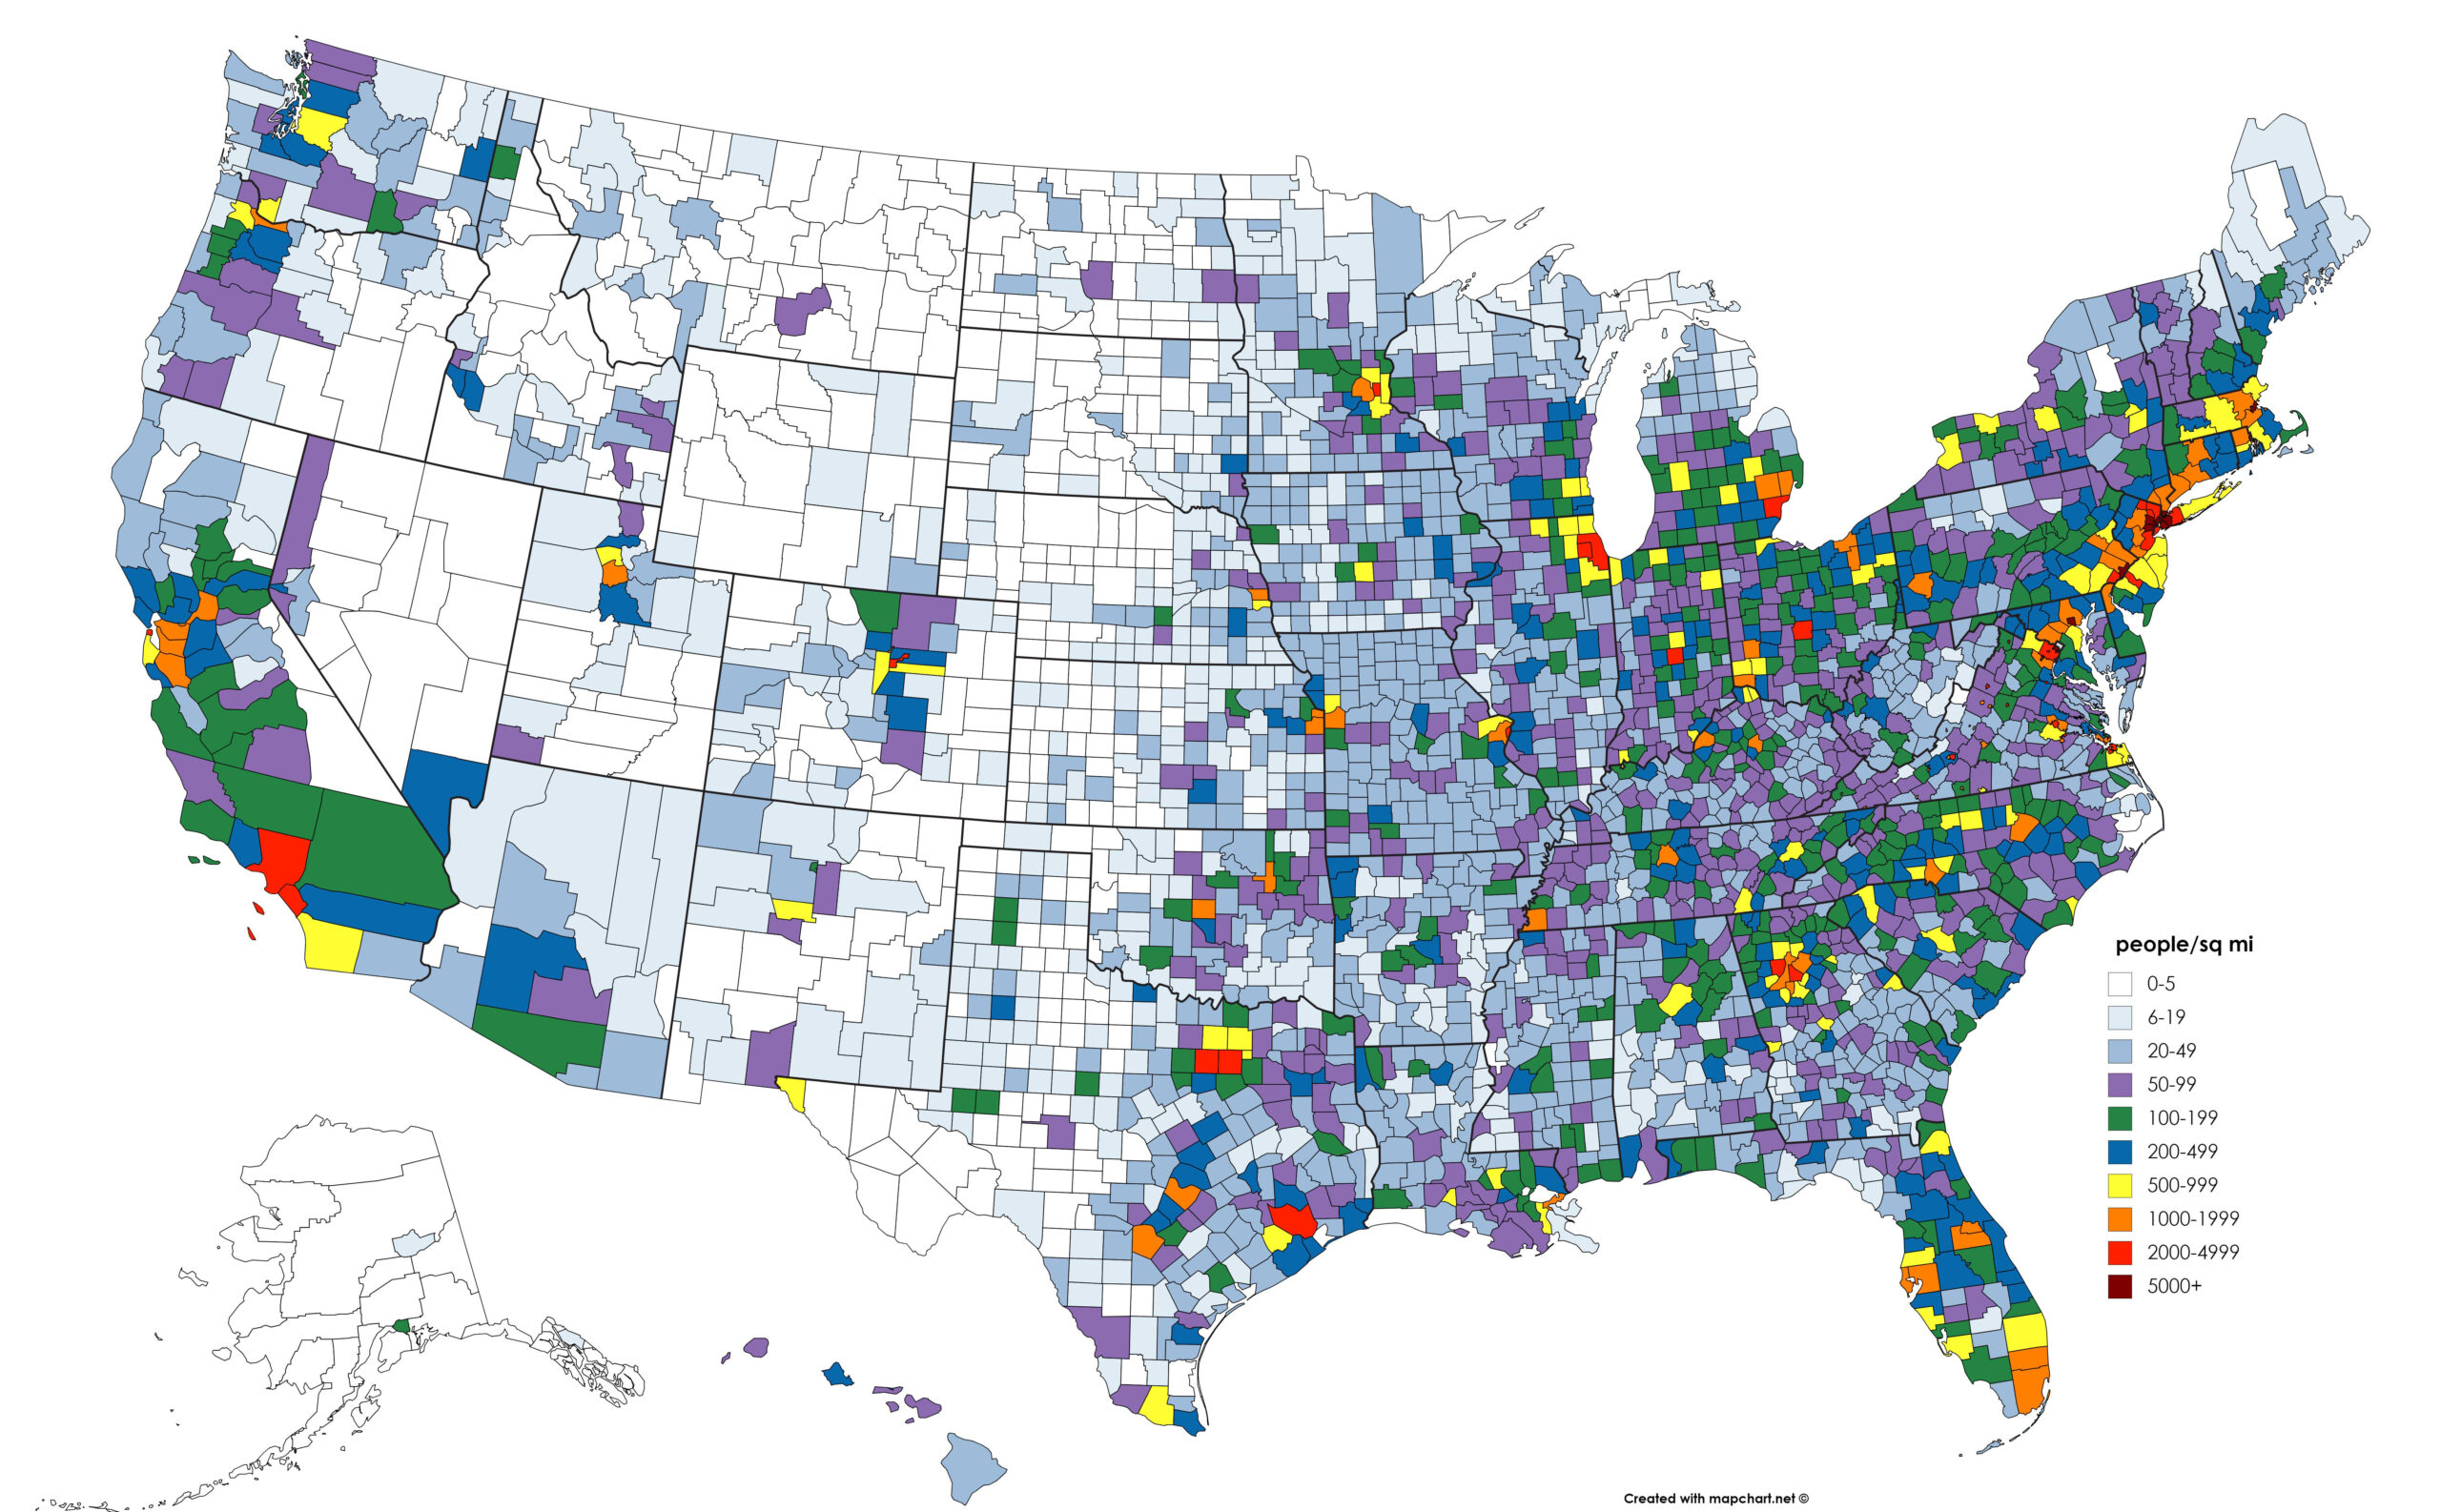
USA Population Density Map | Printable Map Of USA
US Population Density Map - Guide Of The World
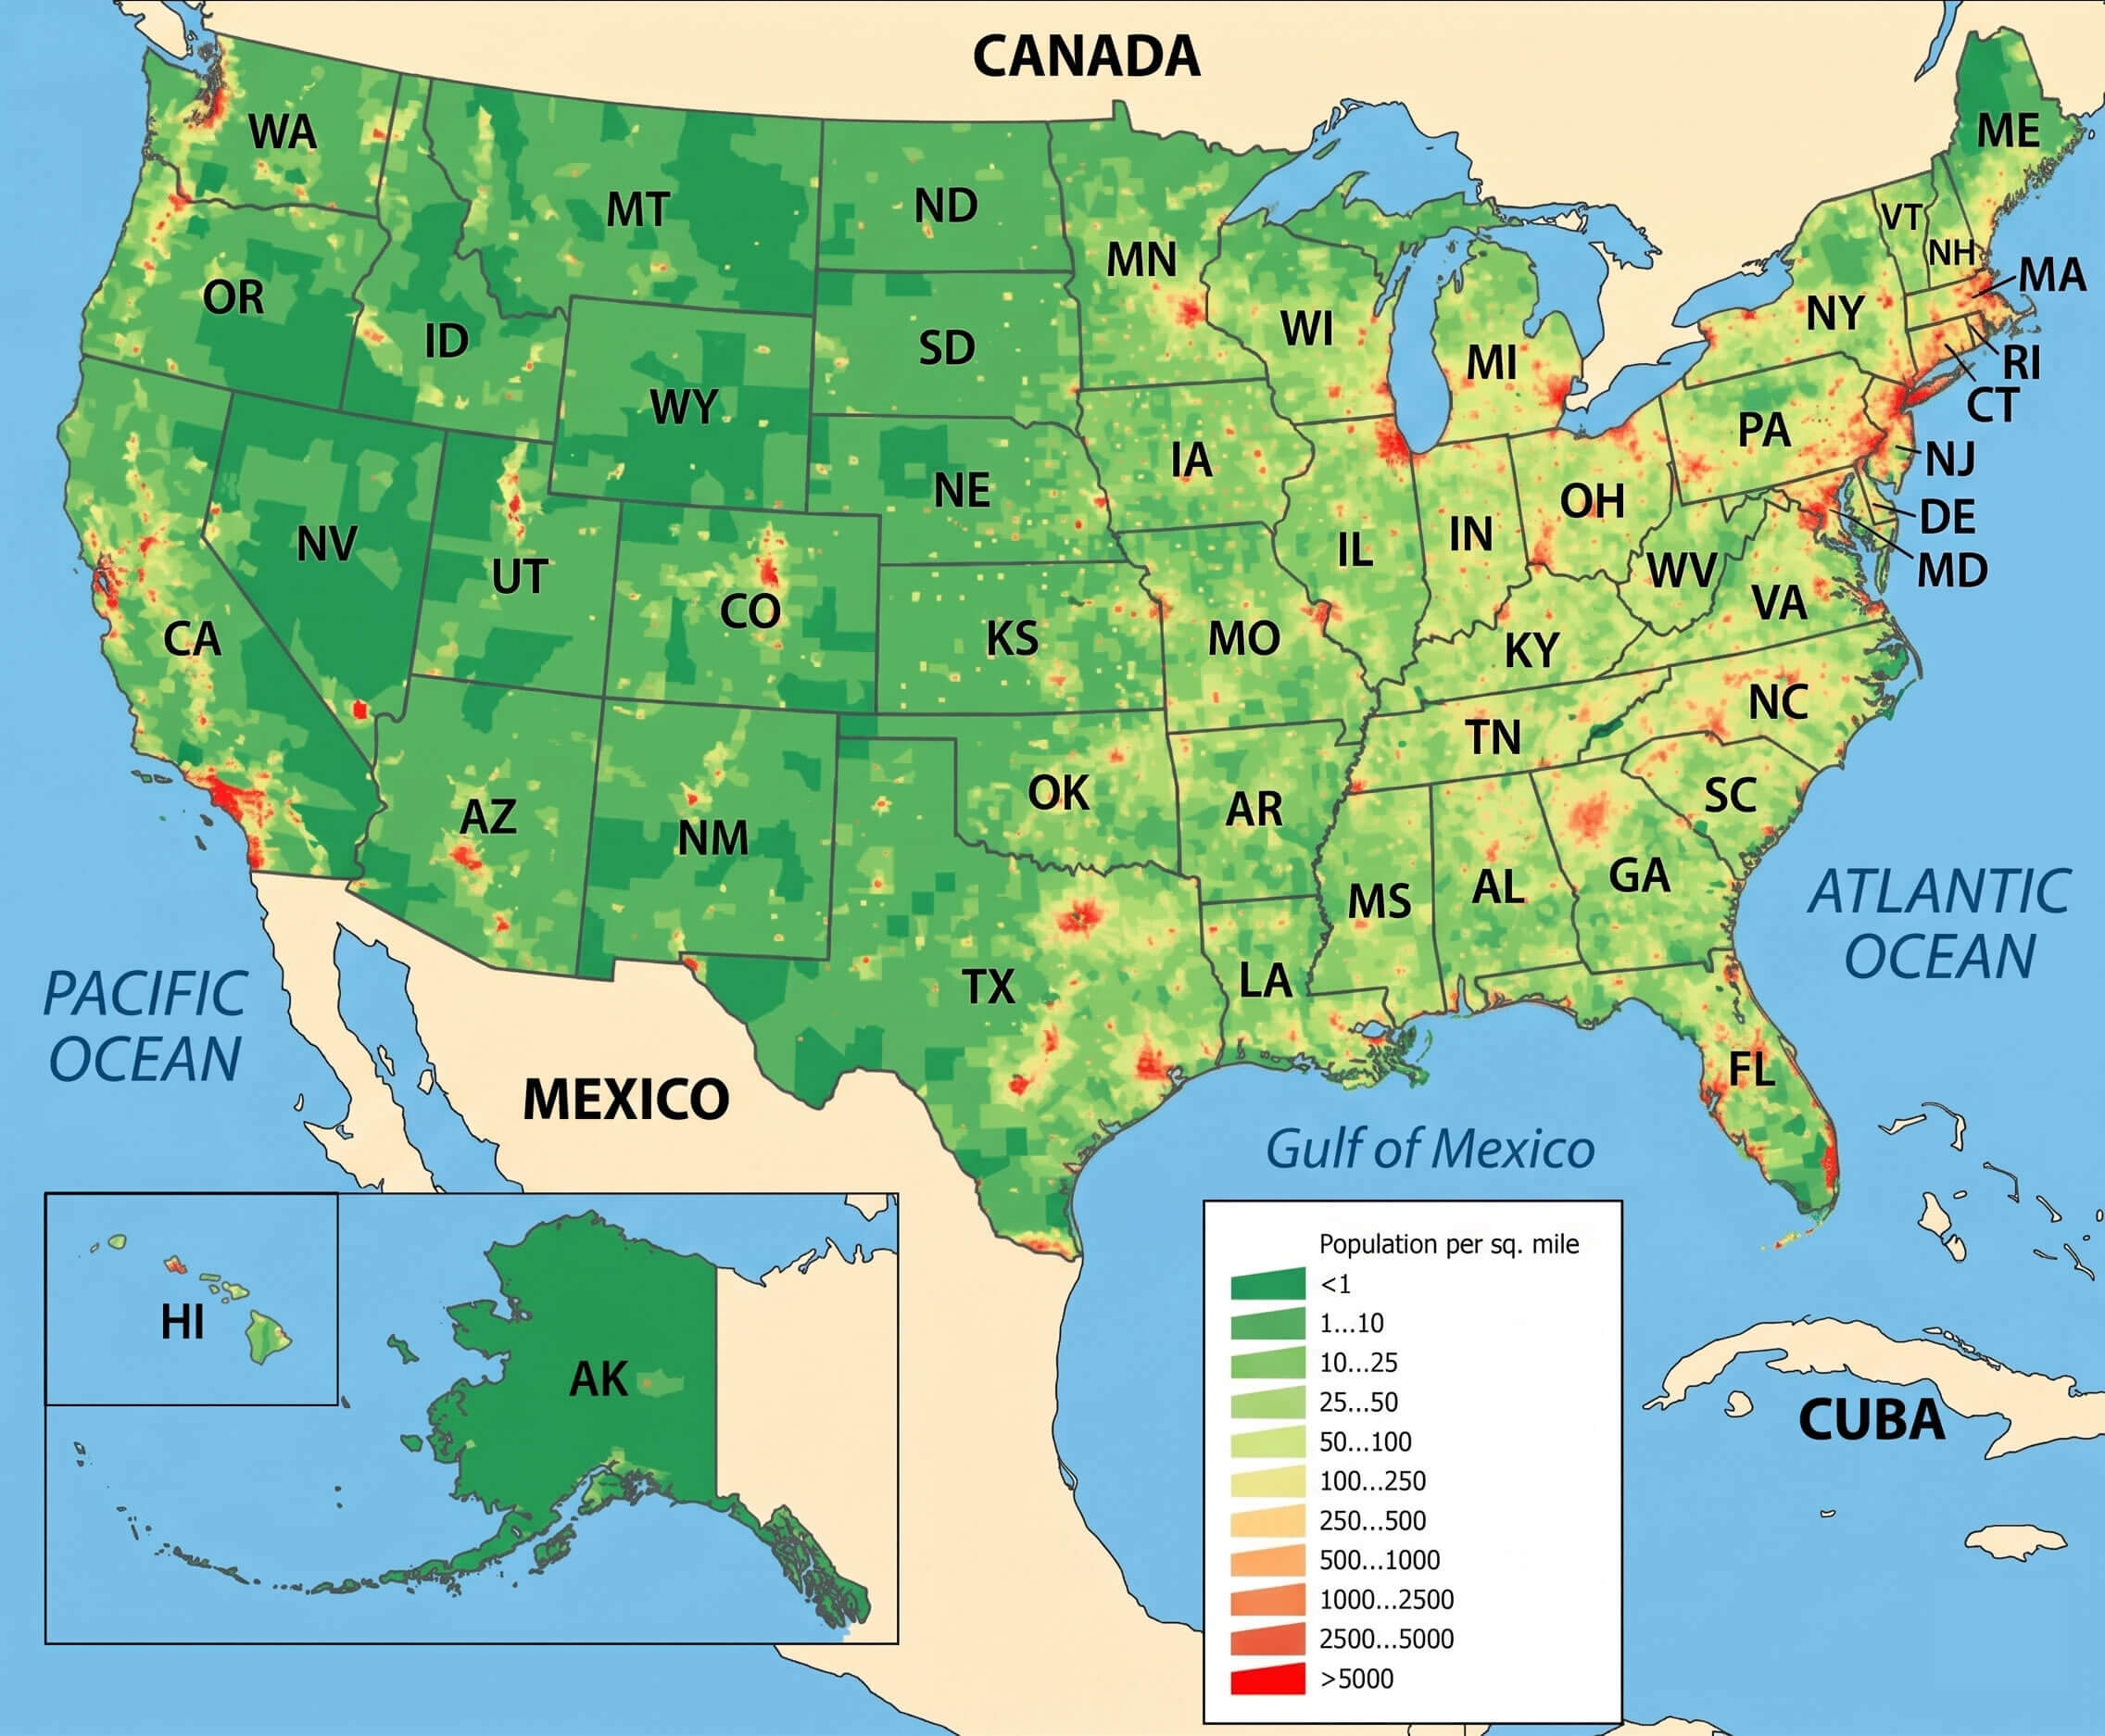
US Population Density Map - Guide of the World
Us Map Population Density Capturing The Size And Density Of New York

Us Map Population Density Capturing The Size And Density Of New York
Us Map Population Density

Us Map Population Density
Mapped: Population Density With A Dot For Each Town
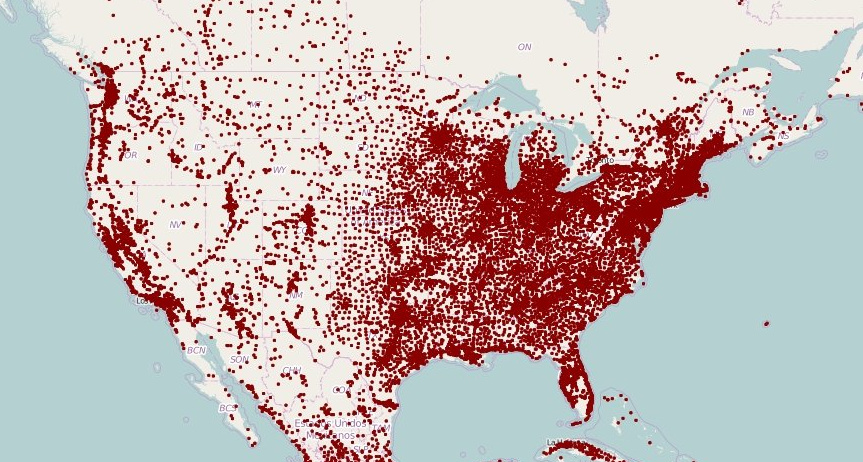
Mapped: Population Density With a Dot For Each Town
U.S. Population Density Map | Map, United States Map, Human Geography

U.S. Population Density Map | Map, United states map, Human geography
United States Population Density Map

United States Population Density Map
Us Map Population Density
Us Map Population Density
USA Population Density Map | MapBusinessOnline
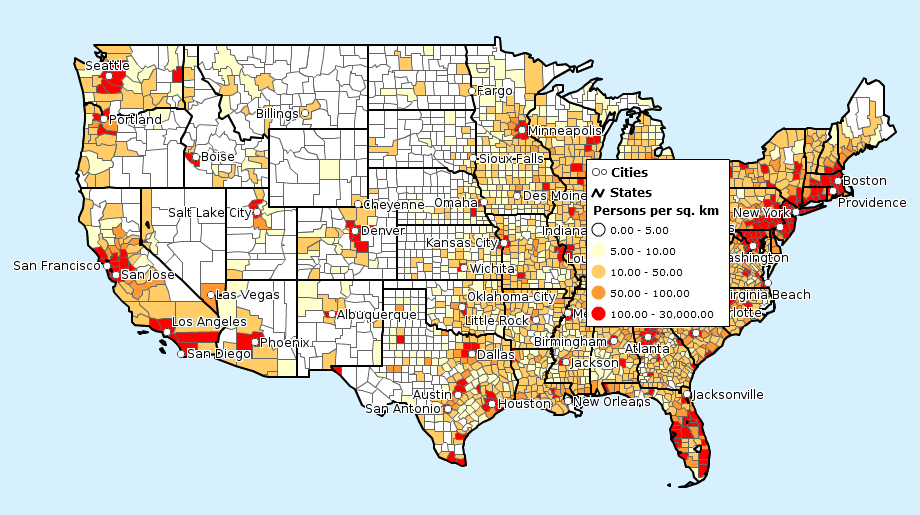
USA Population Density Map | MapBusinessOnline
US Population Density Map - Guide Of The World
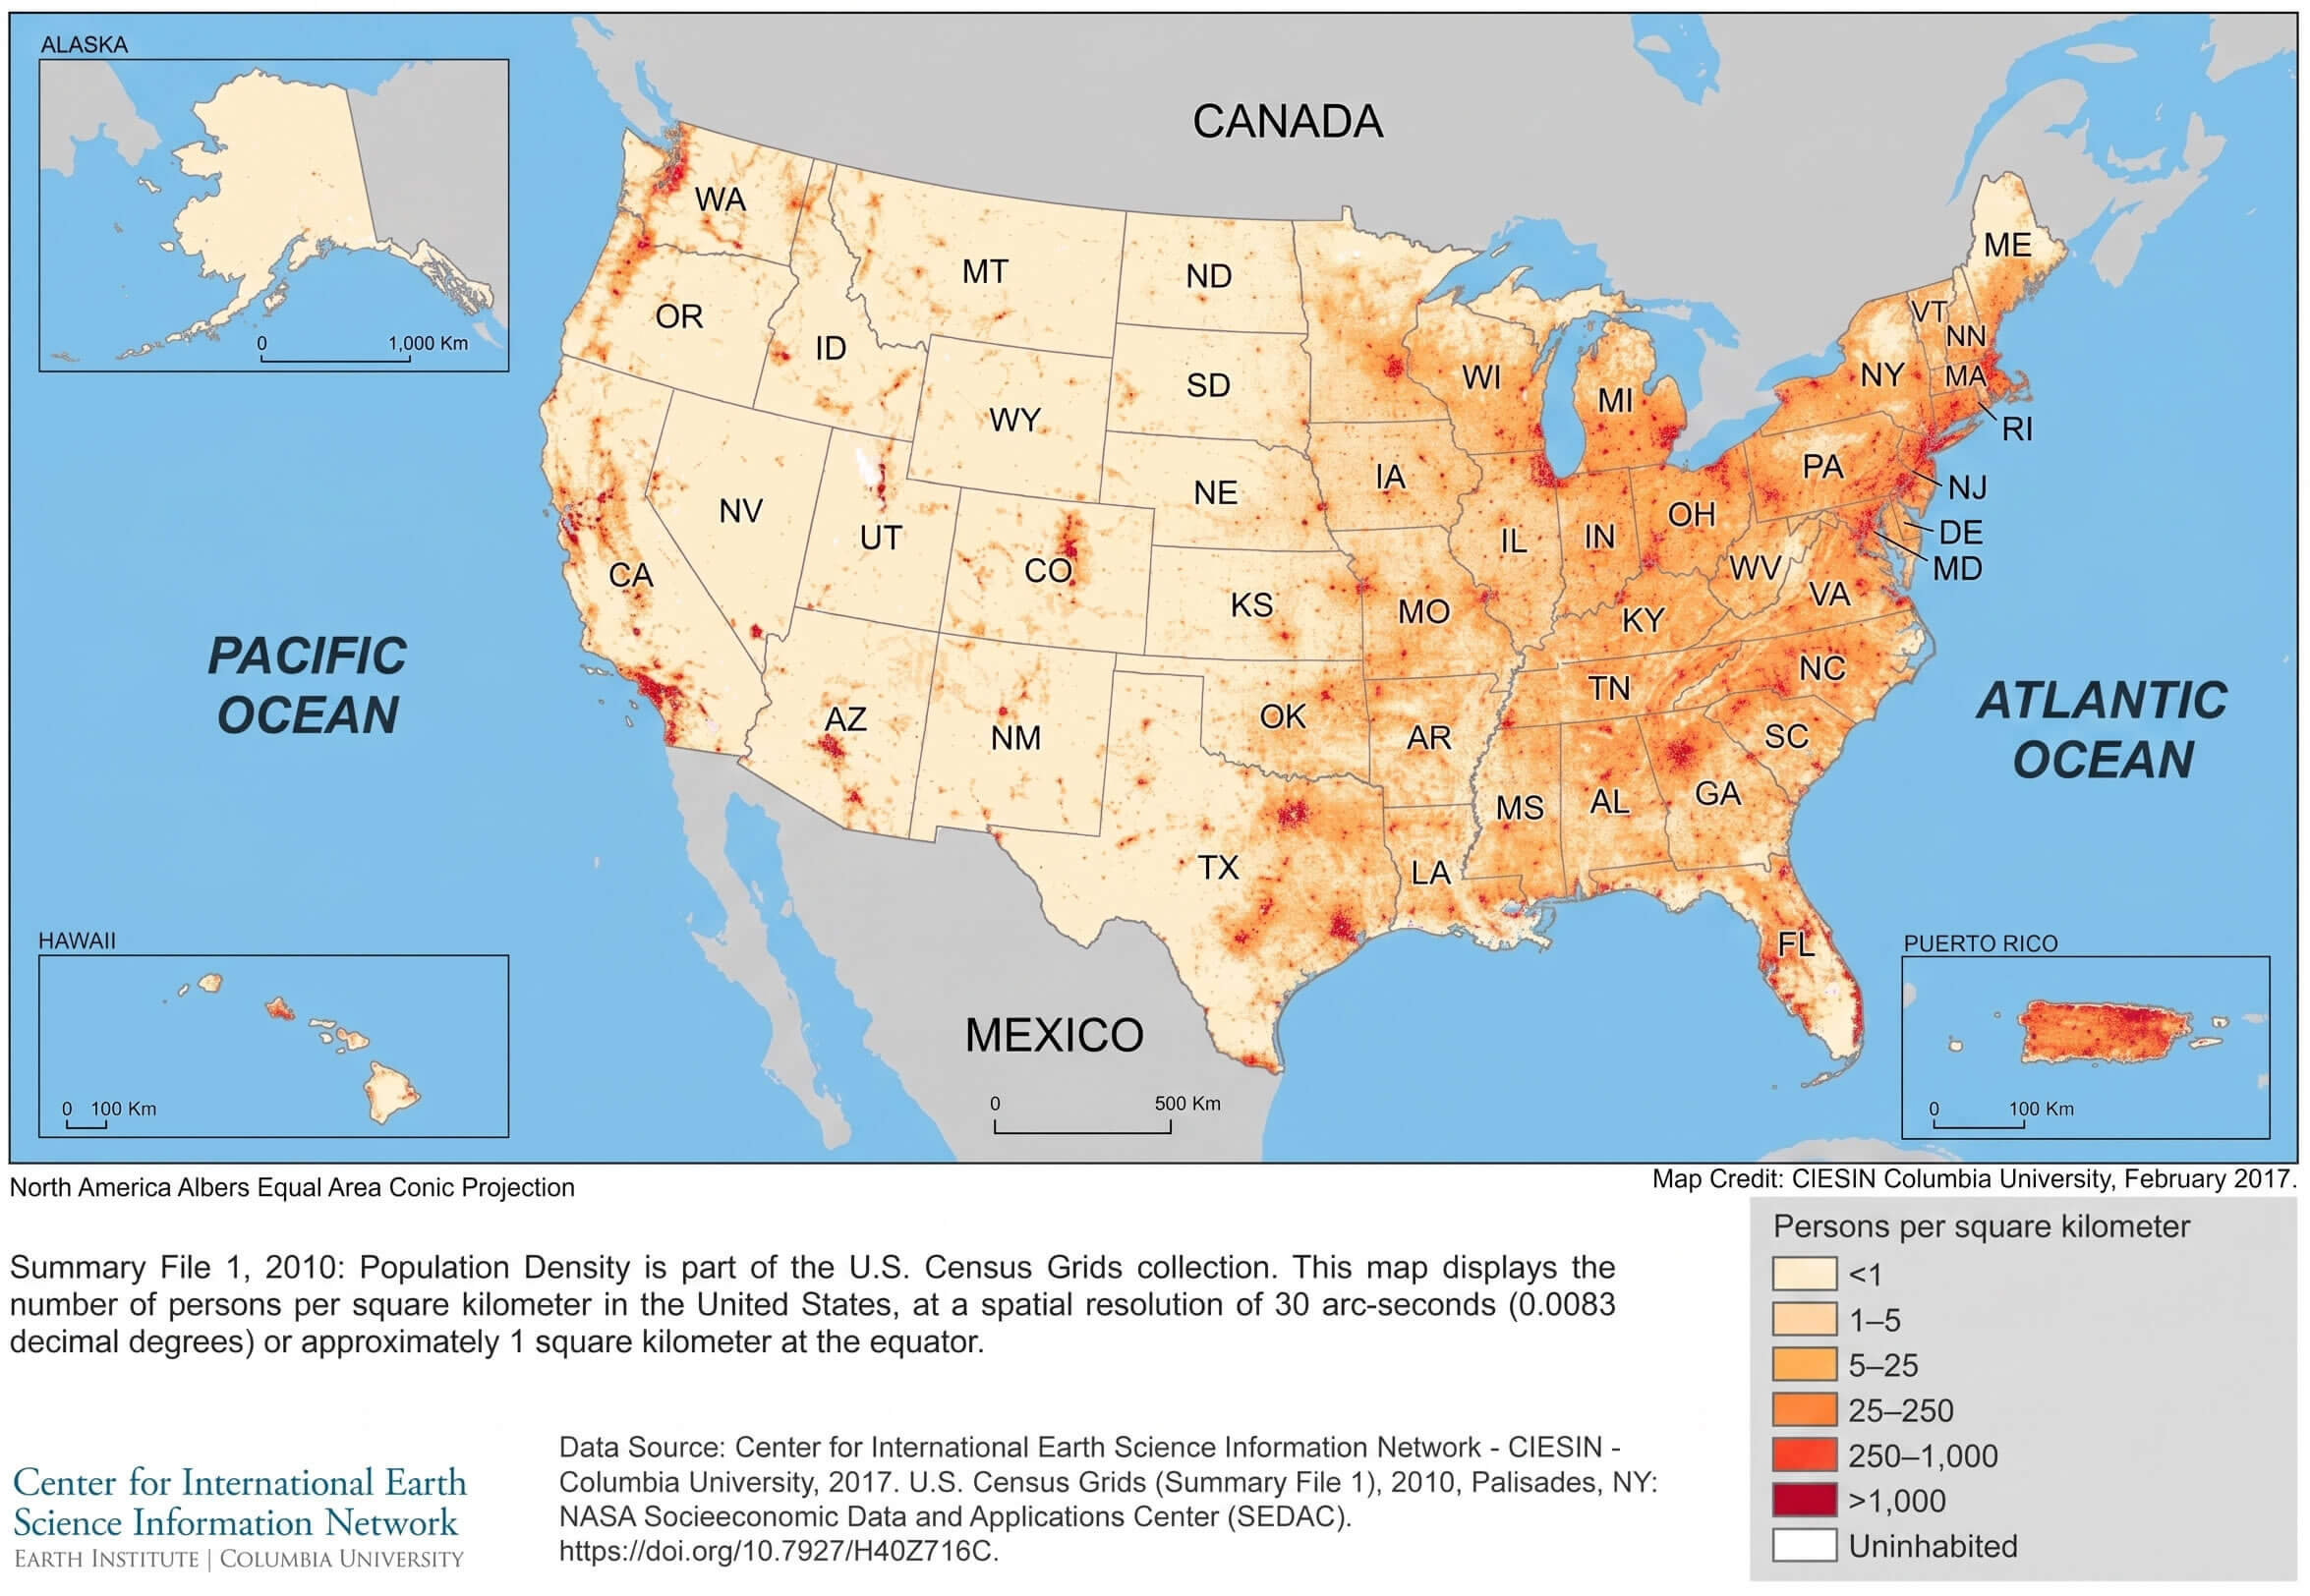
US Population Density Map - Guide of the World
Population Density Map Of USA 2025
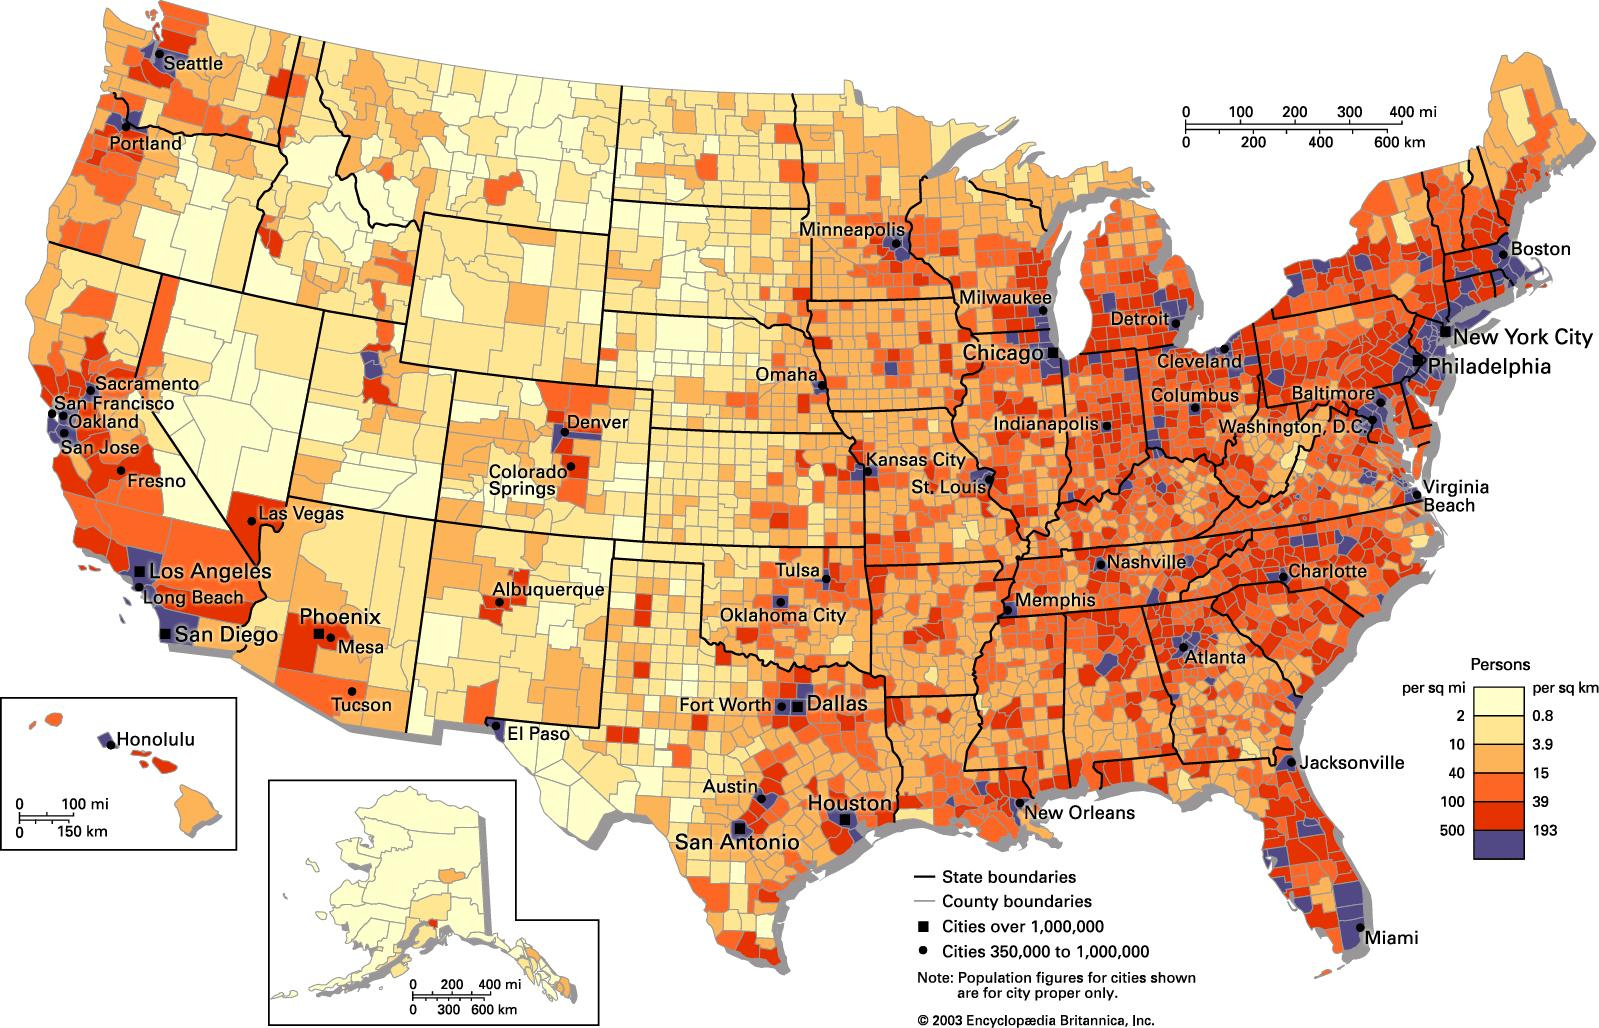
Population Density Map of USA 2025
United States Population Map - Guide Of The World

United States Population Map - Guide of the World
United States Population Density Map

United States Population Density Map
Us Map By Population Density

Us Map By Population Density
U.S. Population Density Mapped - Vivid Maps

U.S. Population Density Mapped - Vivid Maps
US Population Density Map - Guide Of The World
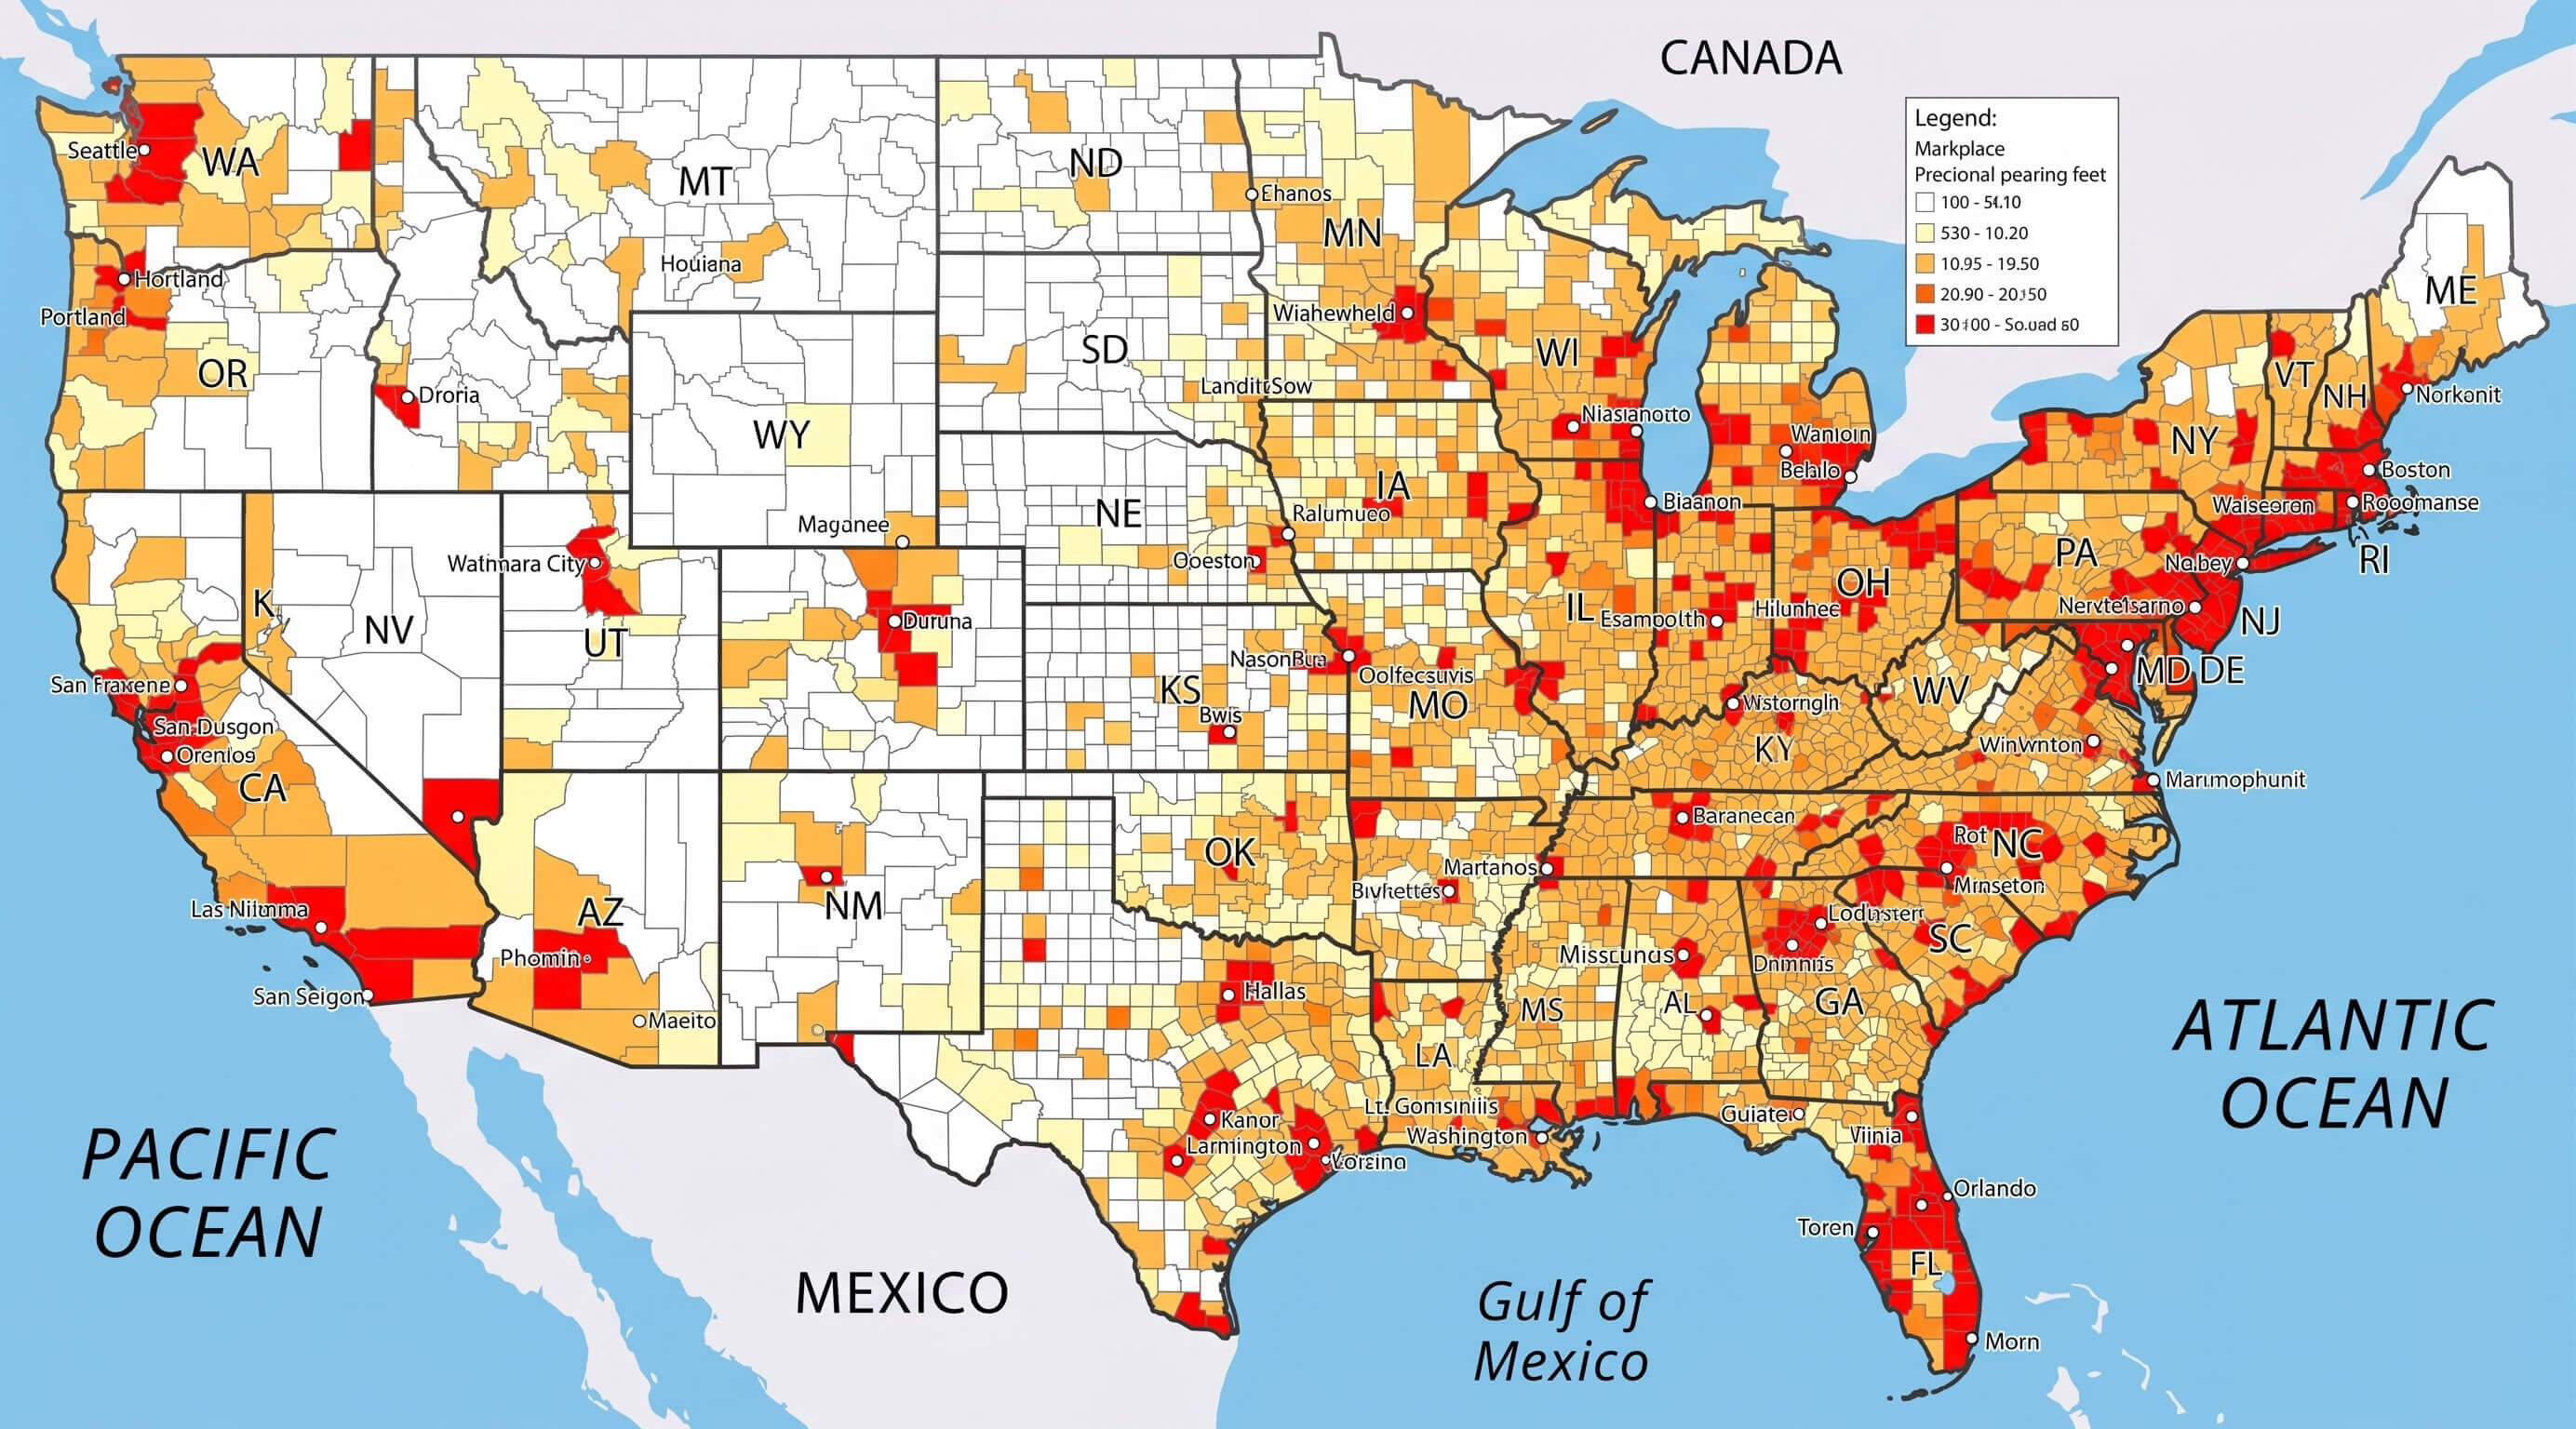
US Population Density Map - Guide of the World
US Population Density Map
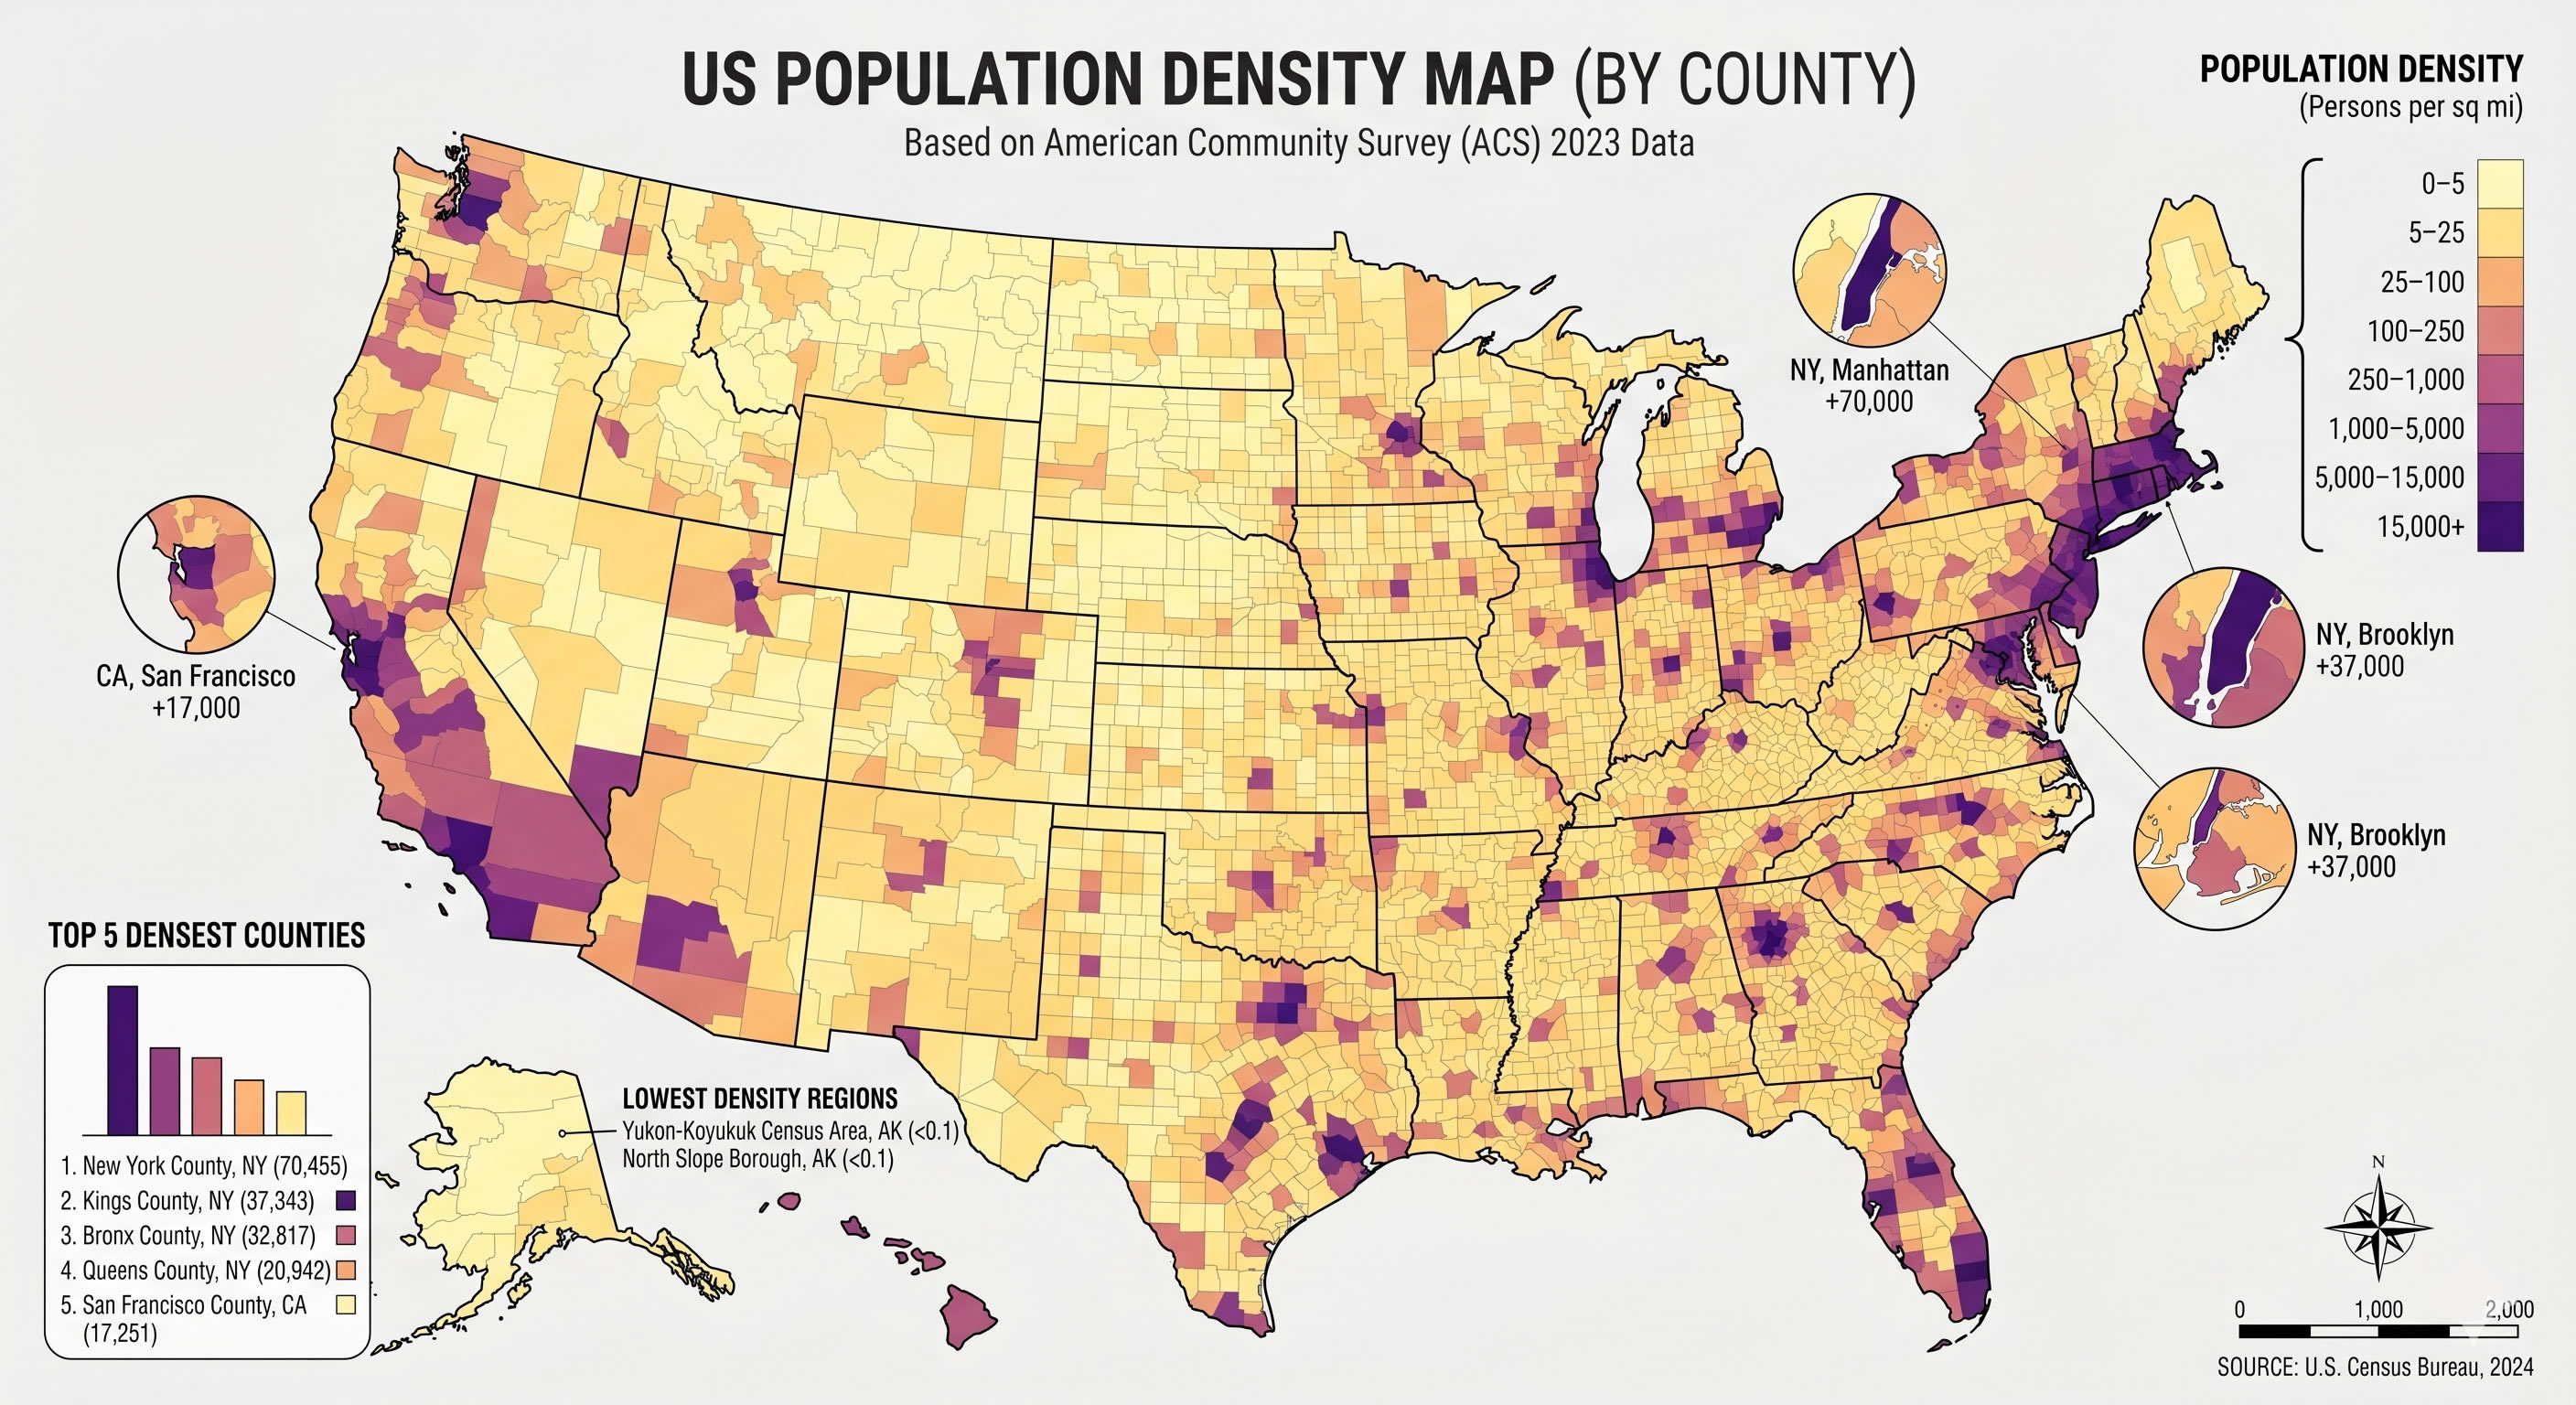
US Population Density Map
United States Population Density Map

United States Population Density Map
United States Population Map - Guide Of The World
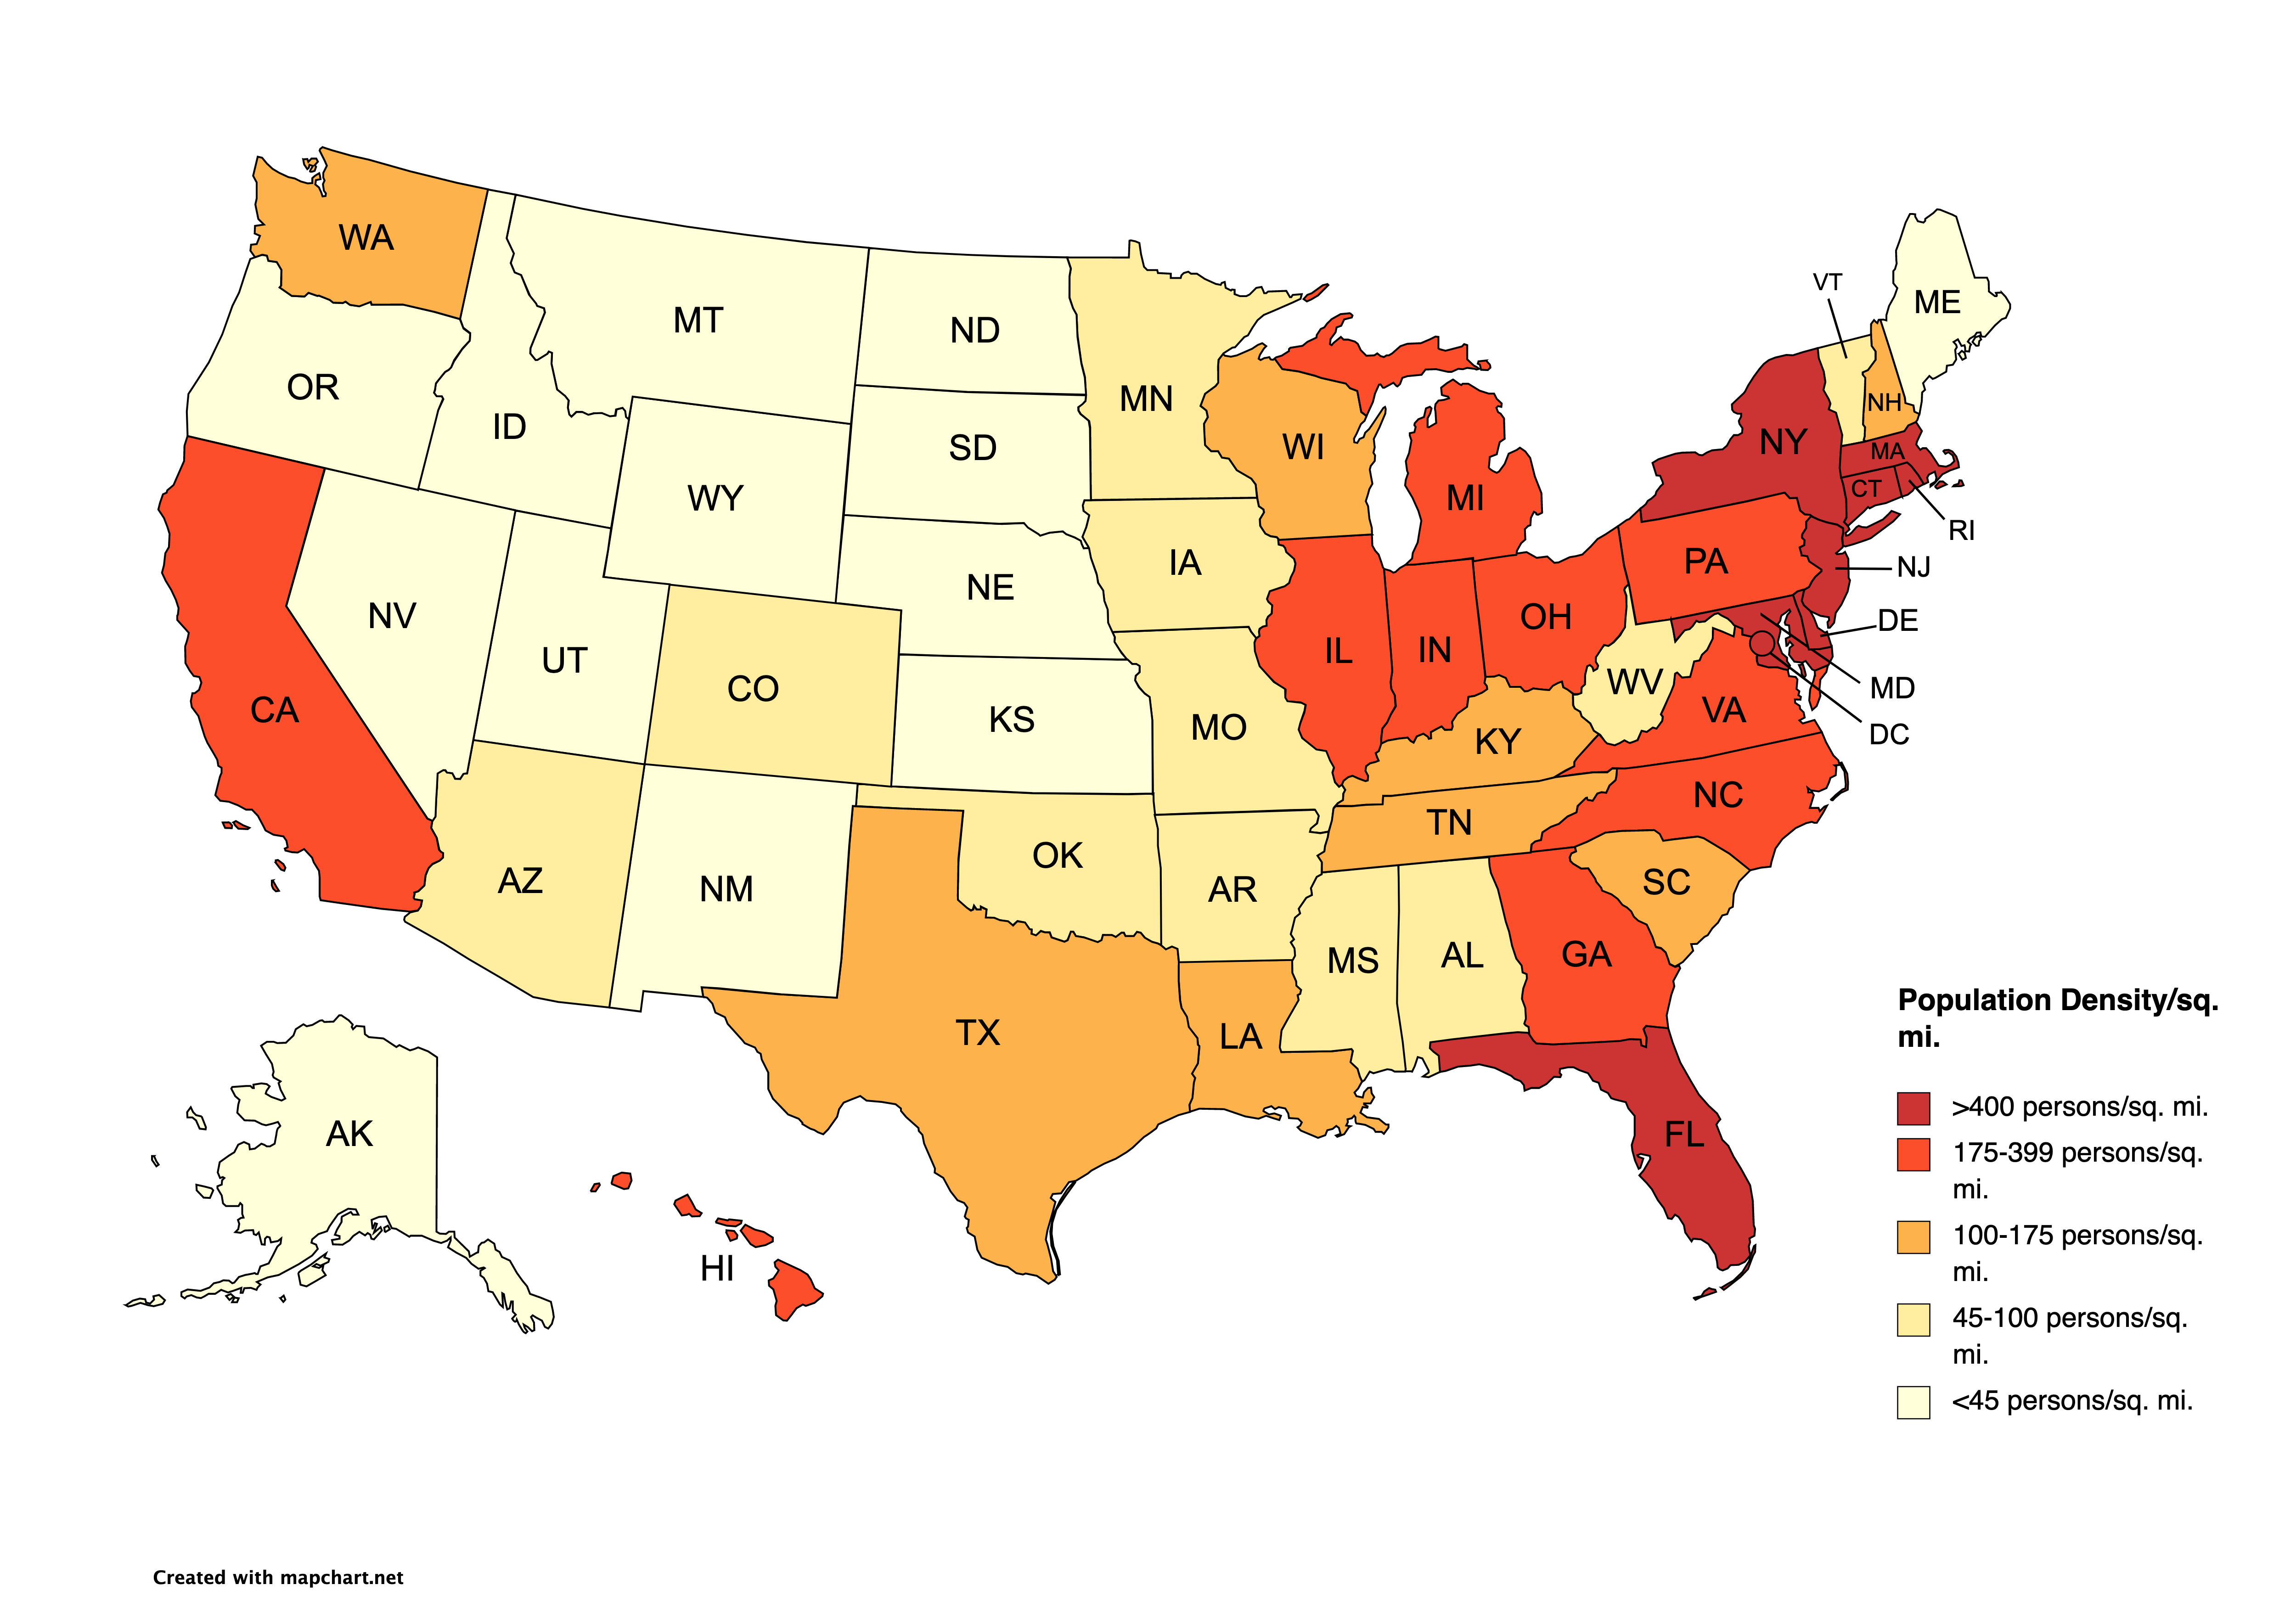
United States Population Map - Guide of the World
Plot Us Population Density On Map Python - Propmens
Plot us population density on map python - propmens
Atlanta Population Density Map 2000 Census And FHWA Adjusted Urbanised

Atlanta Population Density Map 2000 Census And FHWA Adjusted Urbanised
Population Density Map Us United States Population Density Map

Population Density Map Us United States Population Density Map
Population Density Us Interactive Map - Mensmanager
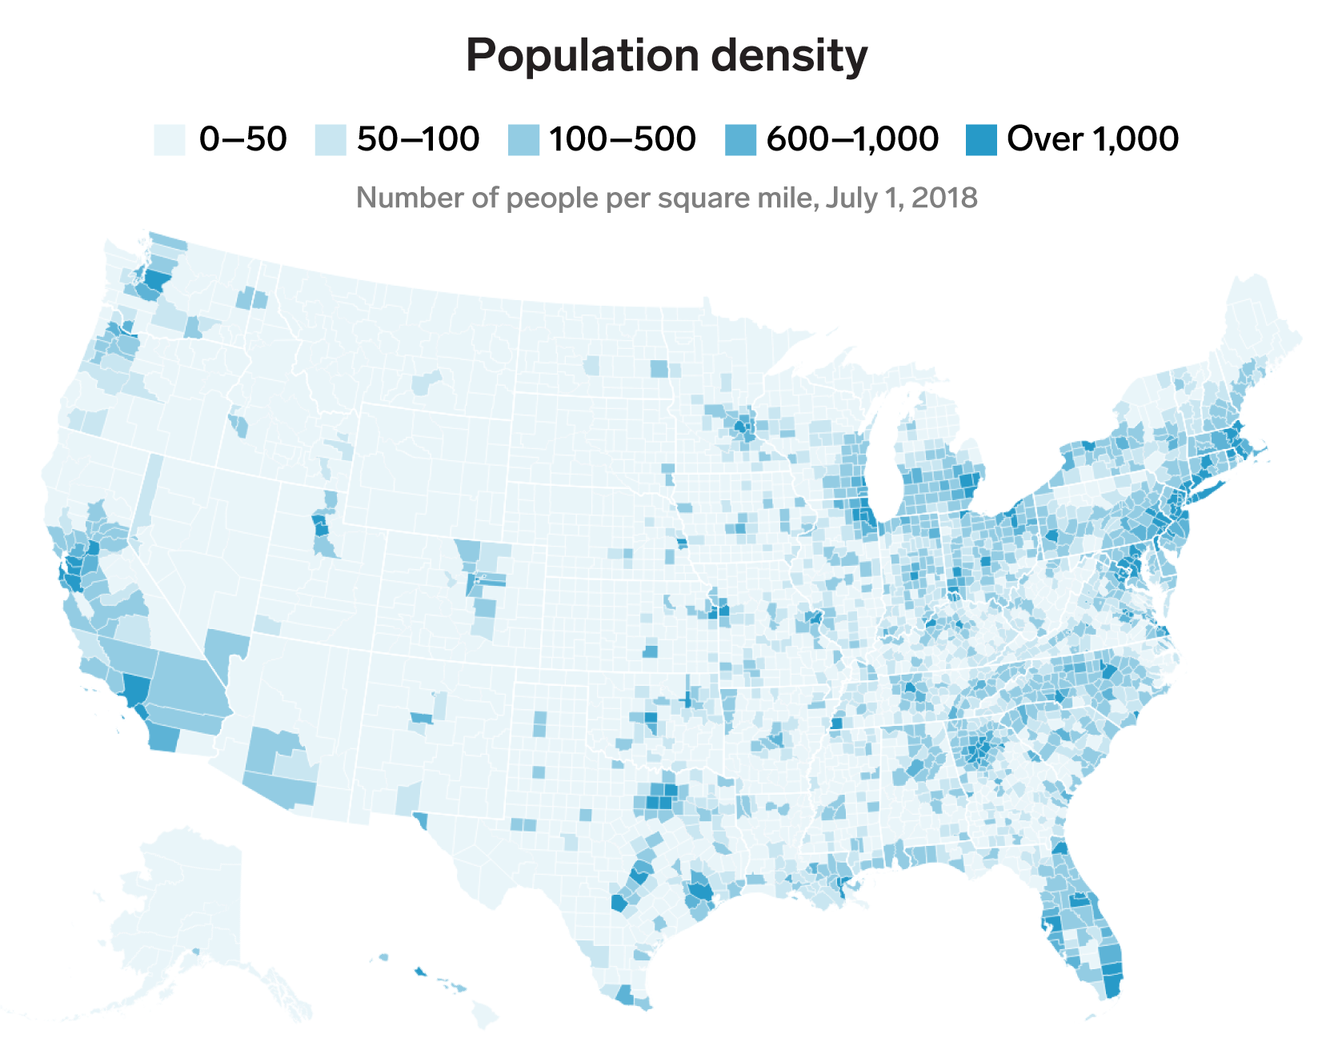
Population density us interactive map - mensmanager
Us Population Density Map - Athometaste
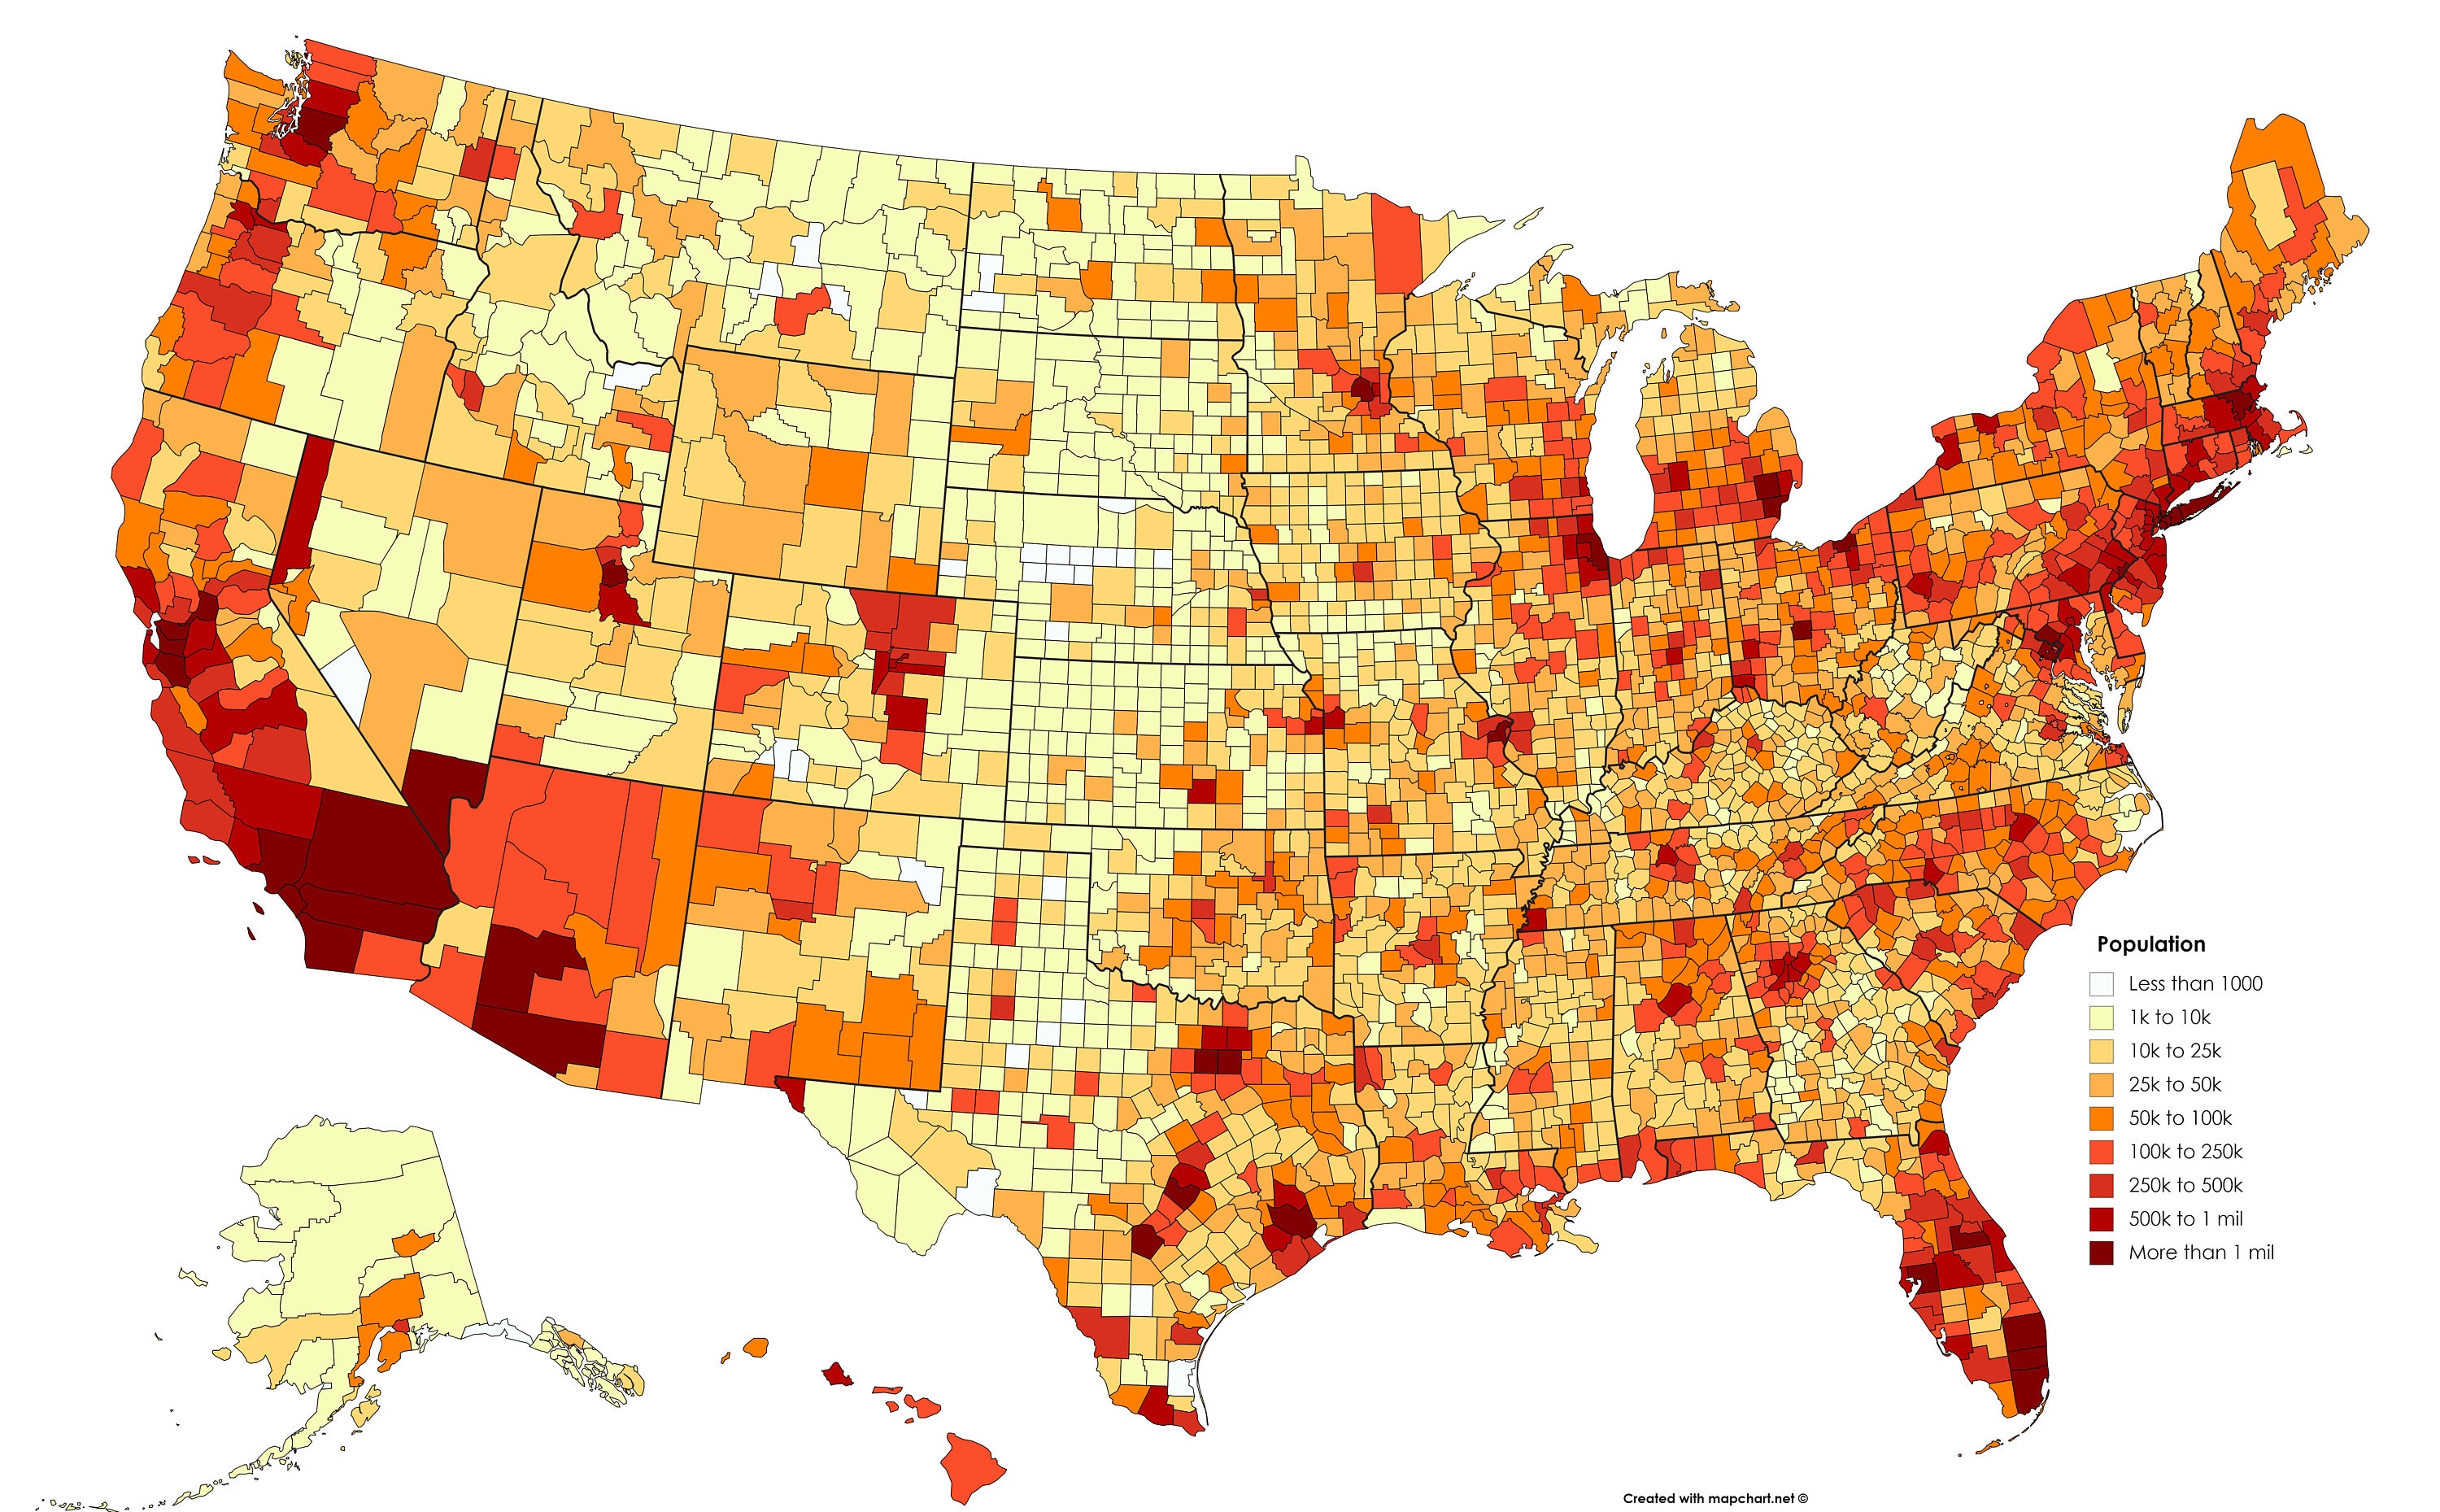
Us population density map - athometaste
Us Population Density Map Interactive - Openwolf
Us population density map interactive - openwolf
USA Population Density Map Free Large Scale United States - US Map
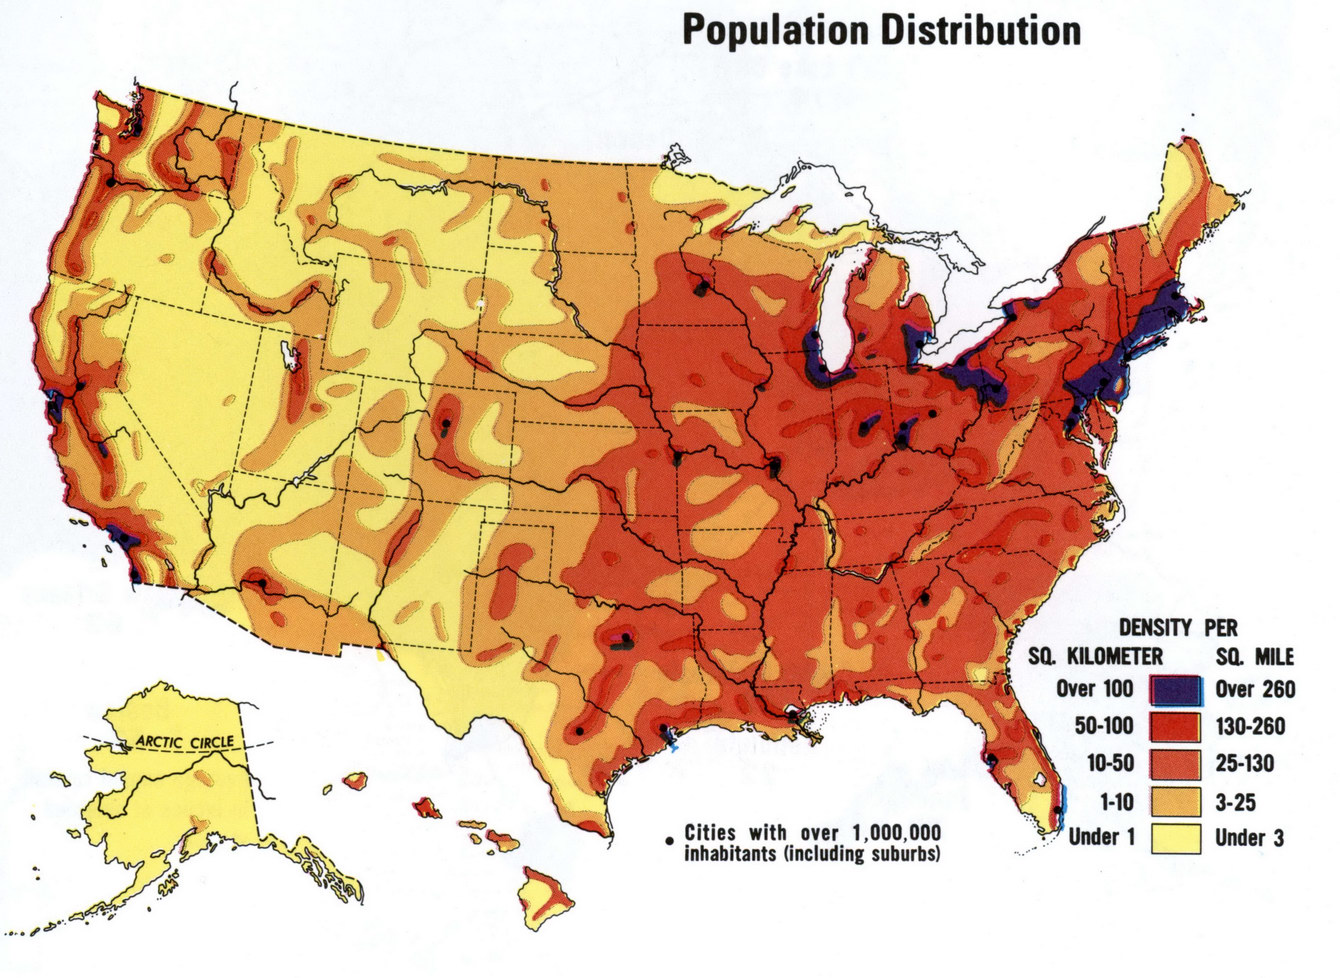
USA Population density map free large scale United States - US map
Us Population Density Map 2016 - Mettolf

Us population density map 2016 - mettolf
Us Population Density 2024
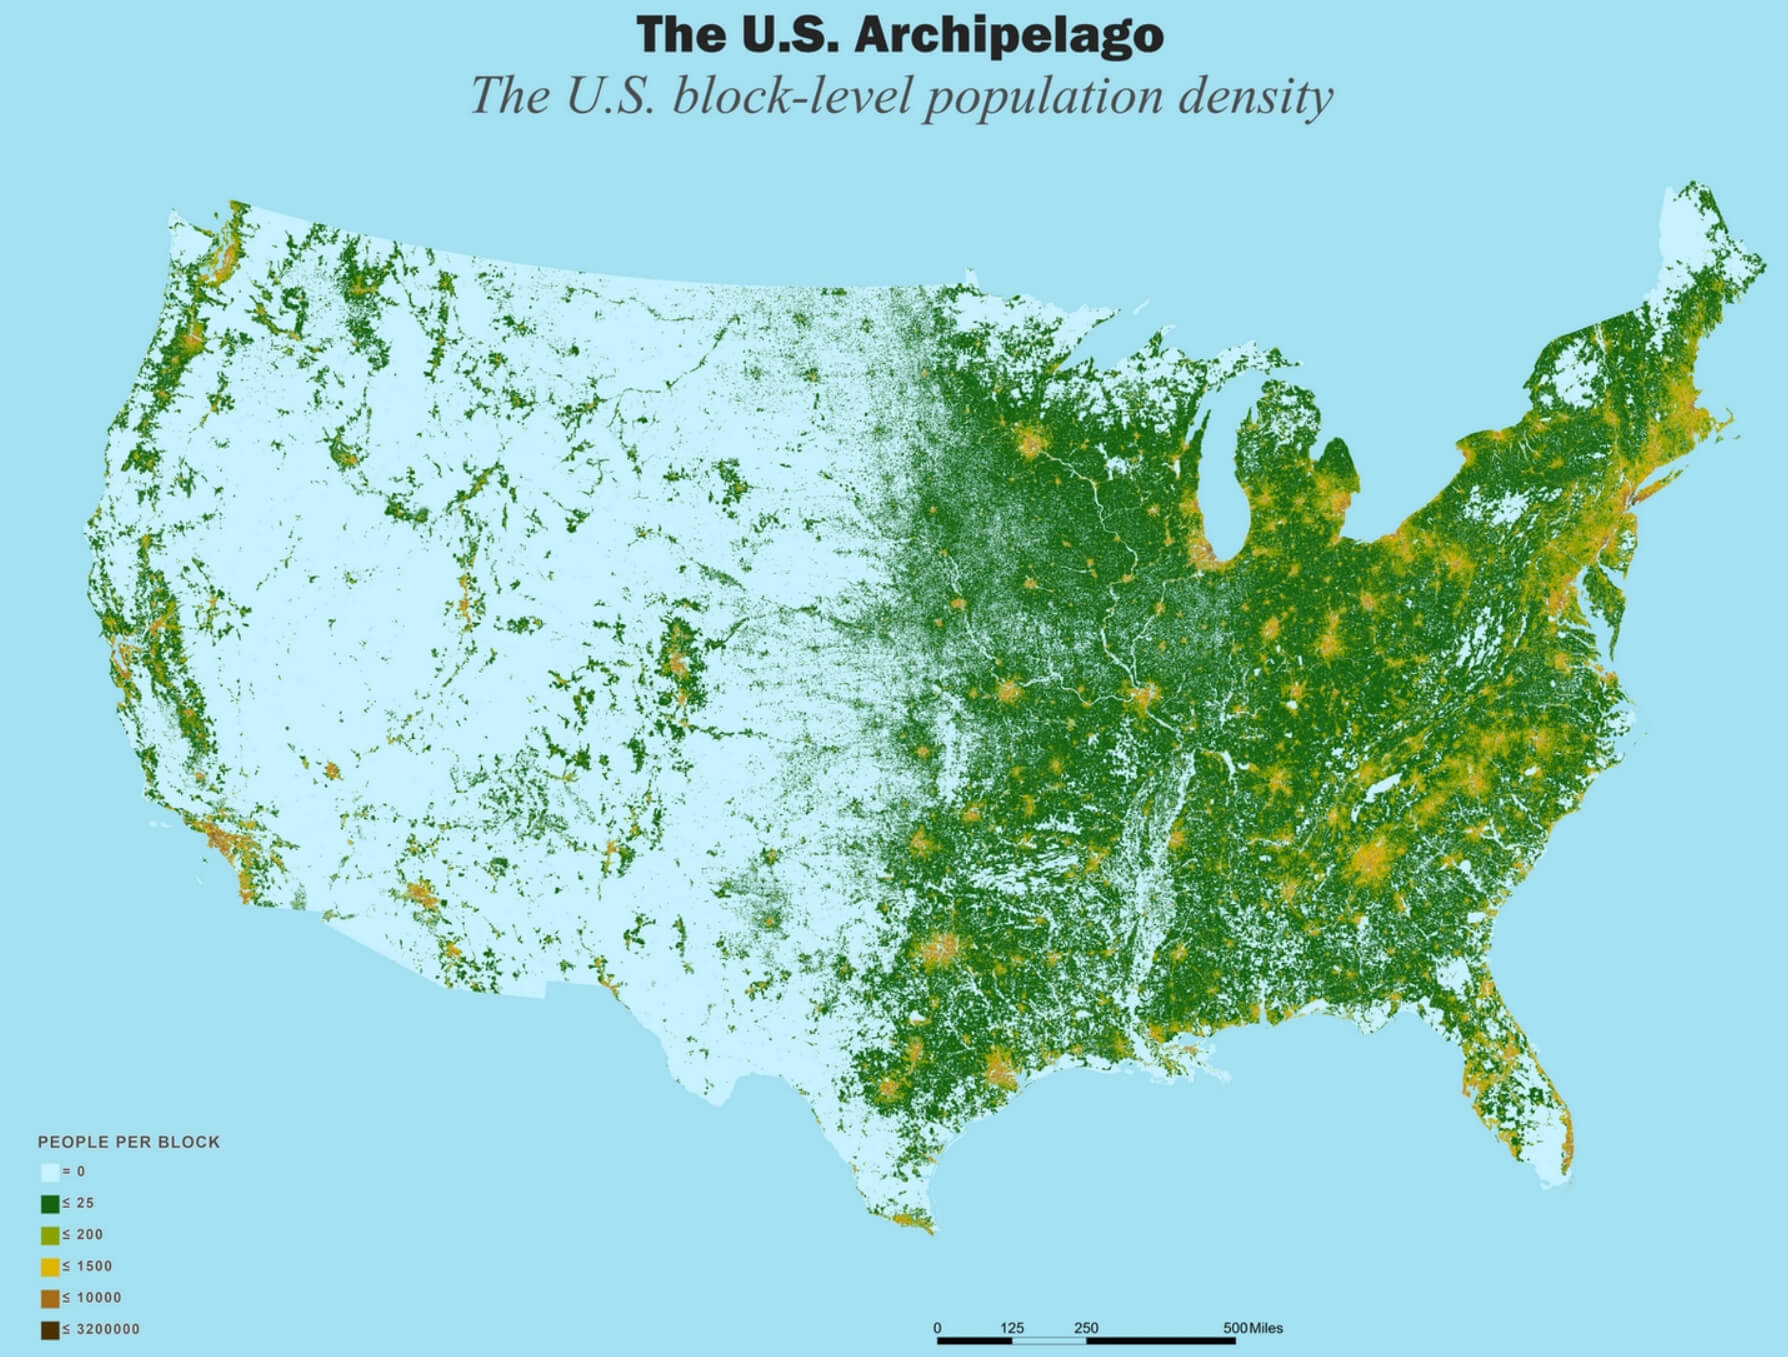
Us Population Density 2024
US Population Density Map - Guide Of The World
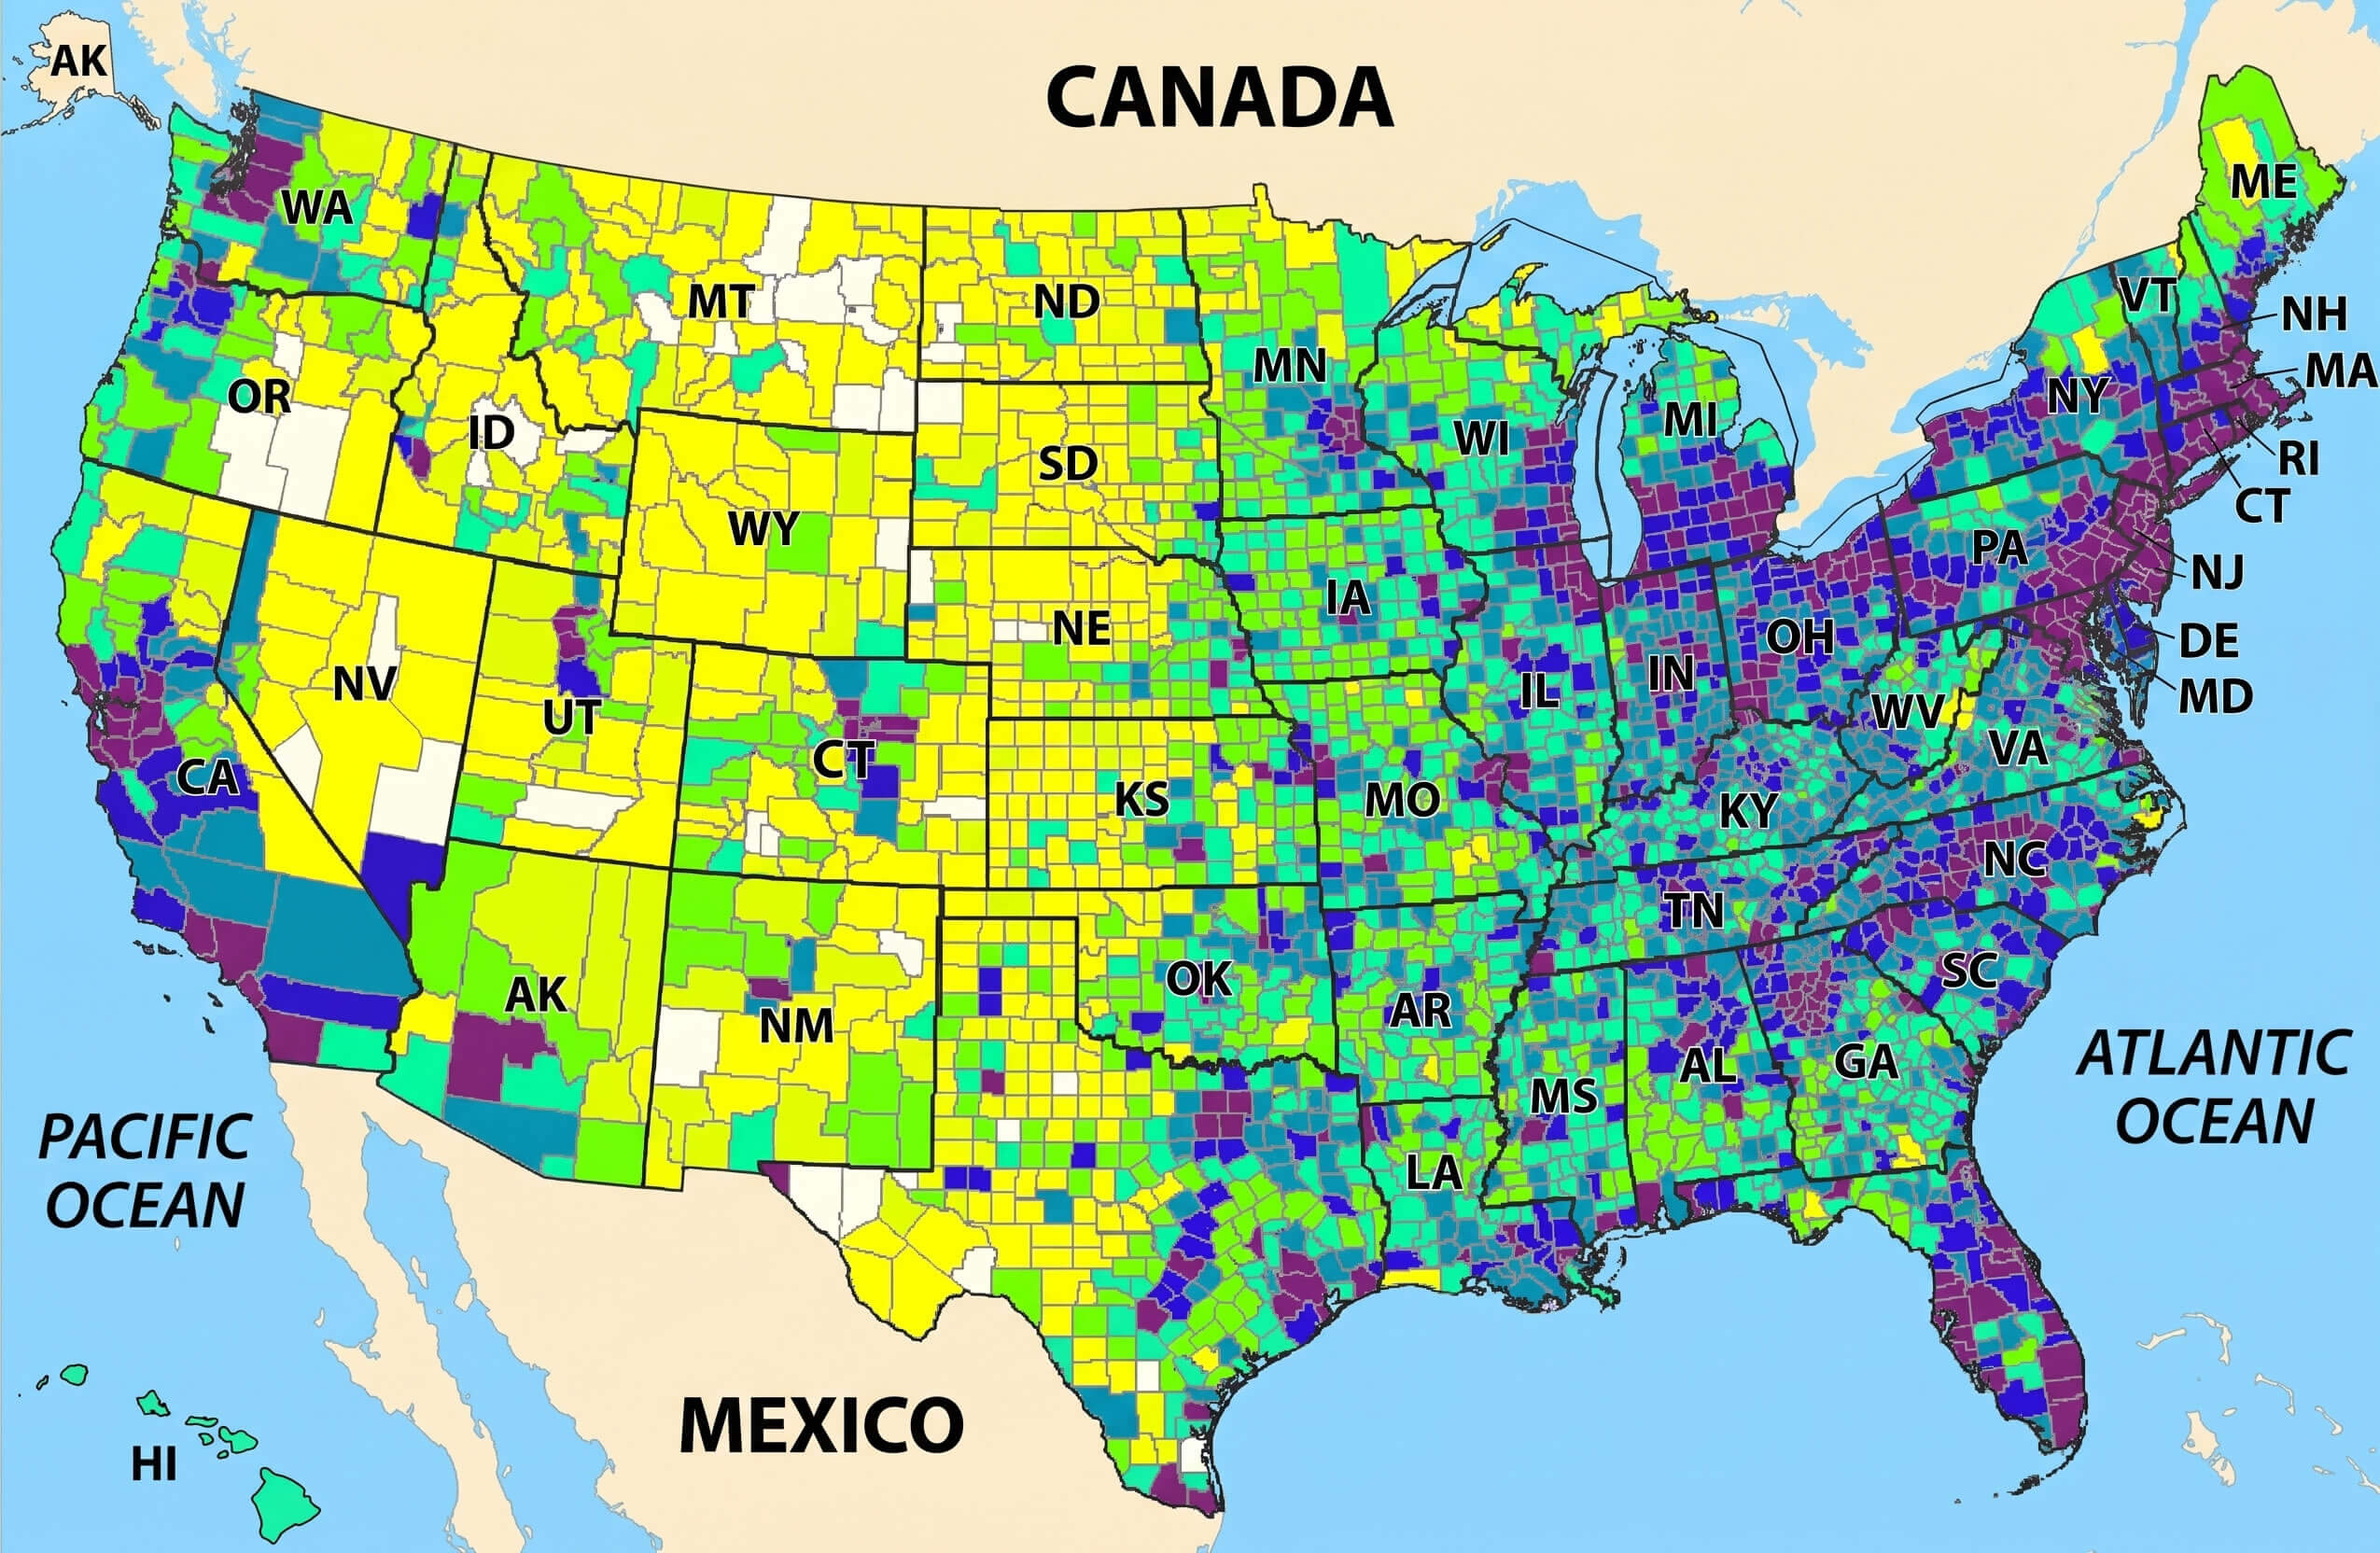
US Population Density Map - Guide of the World
Population Density Map Of USA 2025

Population Density Map of USA 2025
Us Population Density Map 2020 - Pdffeet

Us population density map 2020 - pdffeet
US Population Map - Guide Of The World
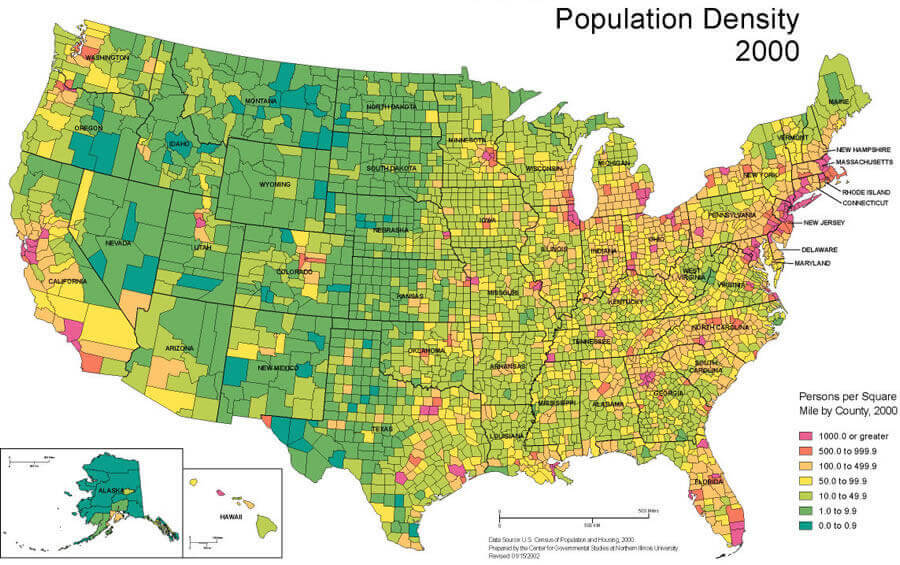
US Population Map - Guide of the World
