US Population Density Heatmap Reveals Shifting Demographic Hubs
New visualizations of U.S. population density underscore a pronounced concentration of residents in the East and West Coasts, with the Midwest and interior West emerging as starkly less populated. The heatmap—generated from the latest Census Bureau data—highlights how urban clusters account for a disproportionate share of the country’s inhabitants while vast tracts of land remain sparsely inhabited.
Nationwide Overview
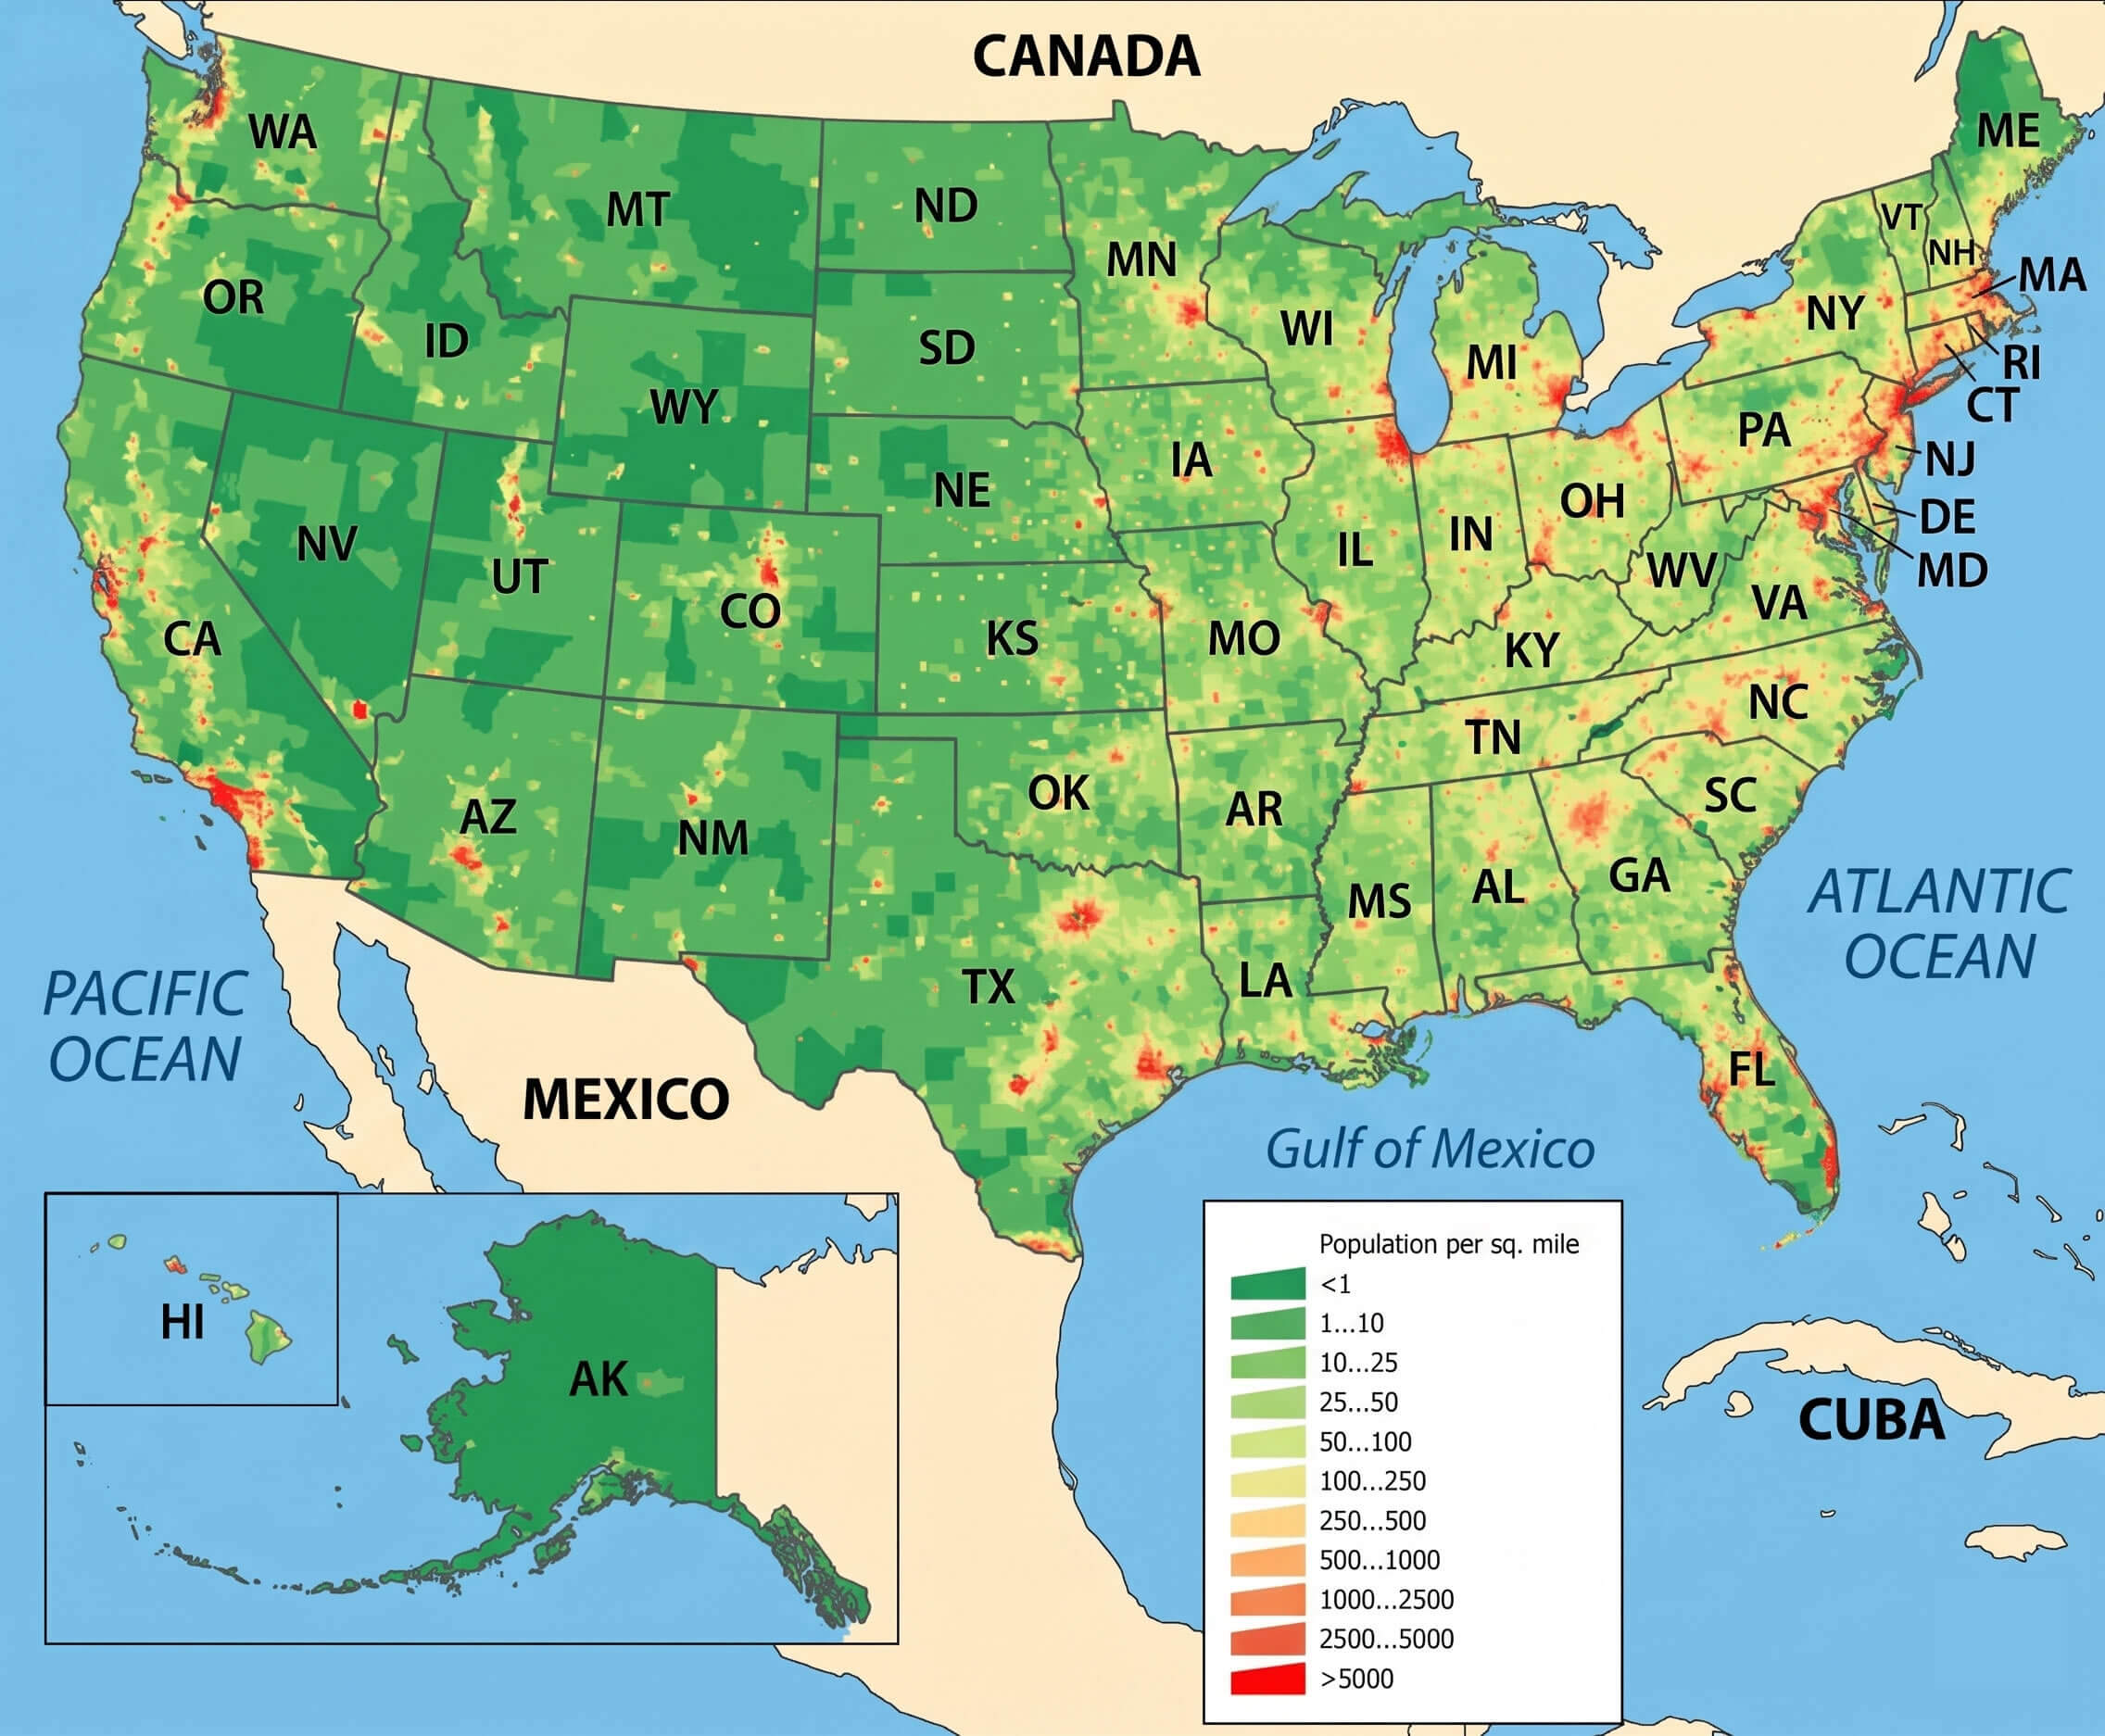
The first map presents a clear, color-coded representation of how people are spread across every state. Areas shaded in deep reds and oranges indicate high population densities, primarily around major cities such as New York, Los Angeles, Chicago, and Dallas. In contrast, large swaths of the Great Plains, the Rockies, and the interior West are depicted in light blues and greens, signaling low density and large land areas per resident.
Urban Cluster Dynamics
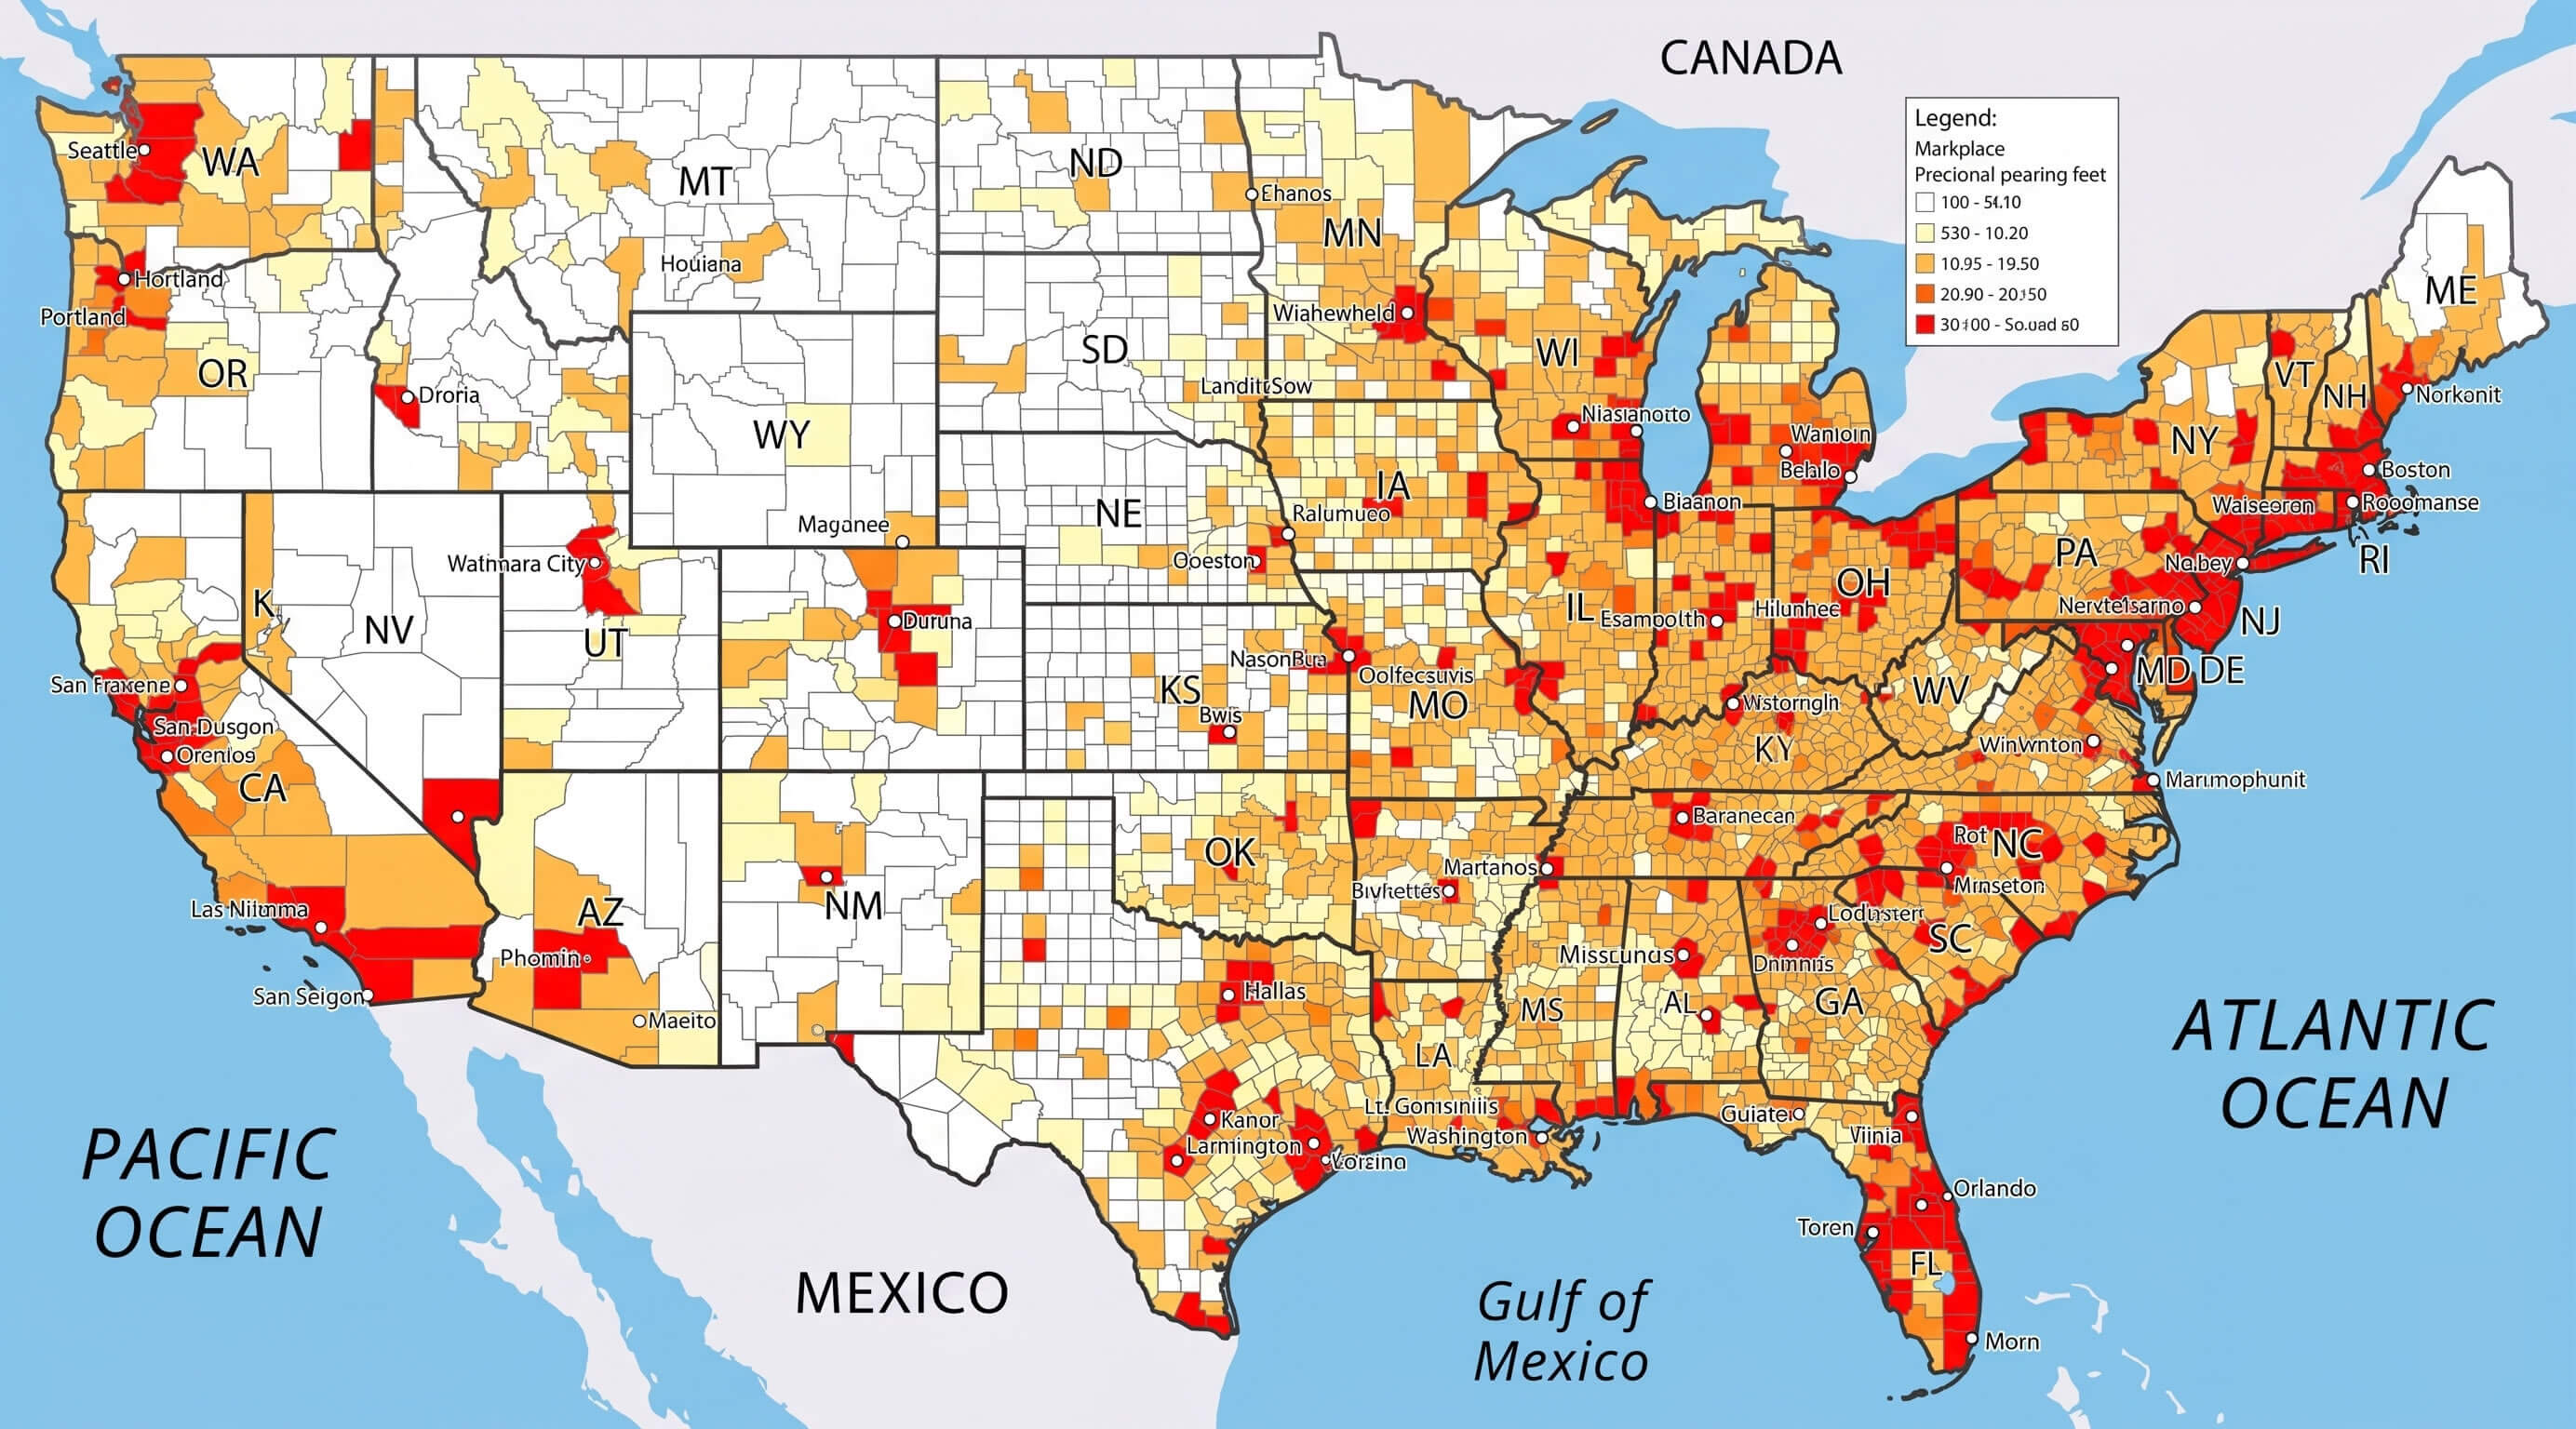
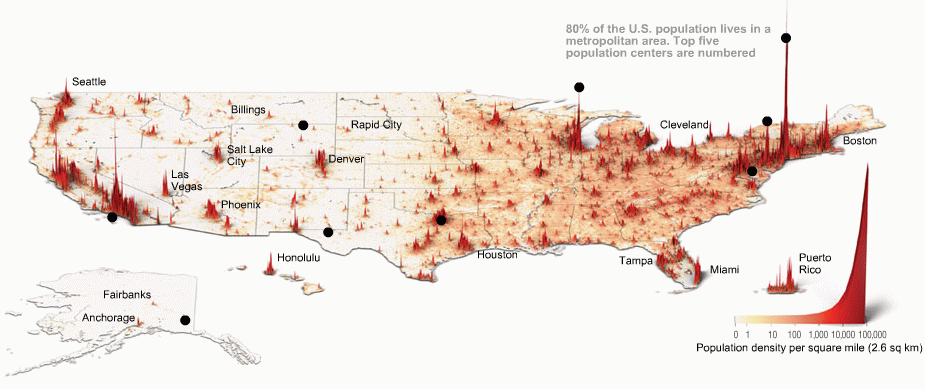
Zooming in on urban regions, the second map focuses on density clusters within cities and their suburbs. It reveals that metropolitan areas such as the New York‑New Jersey‑Long Island corridor, the Greater Los Angeles region, and the Chicago‑O’Hare belt are not only dense but also expanding outward, creating new layers of high-density suburbs that are reshaping regional planning and transportation needs.
Implications for Infrastructure
The concentration of people in a few hotspots imposes significant demands on transportation, housing, and public services. High-density corridors often experience traffic congestion, elevated housing costs, and increased strain on utilities. Conversely, low-density regions face challenges such as maintaining broadband connectivity, providing emergency services across wide areas, and sustaining local economies in the face of demographic decline.
Economic and Environmental Consequences
Economic activity tends to cluster where people live, making dense areas hubs for commerce, technology, and innovation. However, the environmental footprint of such concentrations—ranging from increased air pollution to higher water usage—necessitates balanced urban planning. Meanwhile, rural expanses, while offering lower environmental impact, must grapple with limited access to healthcare, education, and economic diversification.
Future Projections
Forecasts suggest that the U.S. will see continued growth in metropolitan cores, especially along the coasts, while some interior regions may experience population stagnation or decline. Policymakers and planners will need to interpret these density patterns to allocate resources effectively, invest in sustainable infrastructure, and address disparities in service provision between densely populated urban centers and the quieter, sprawling countryside.
US Population Map - Guide Of The World
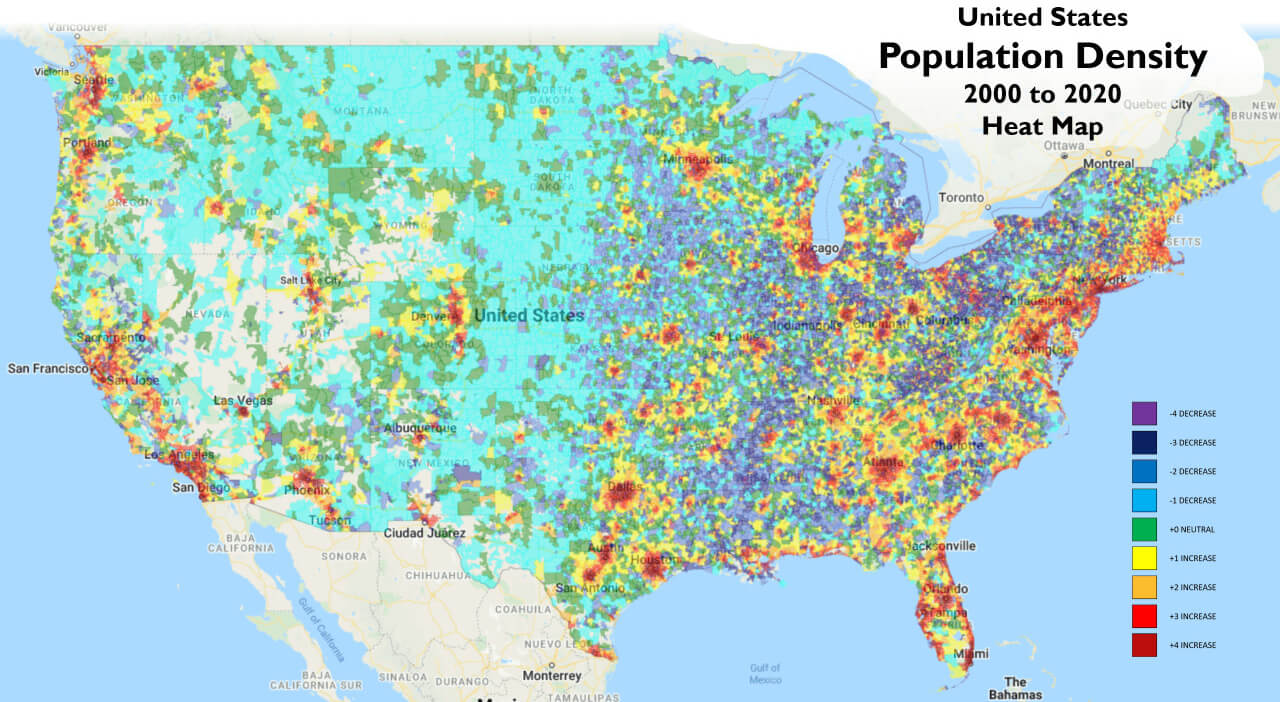
US Population Map - Guide of the World
Population Density Map Of The Us - Map Of Rose Bowl

Population Density Map Of The Us - Map Of Rose Bowl
Us Population Density Heat Map - Aholicmens
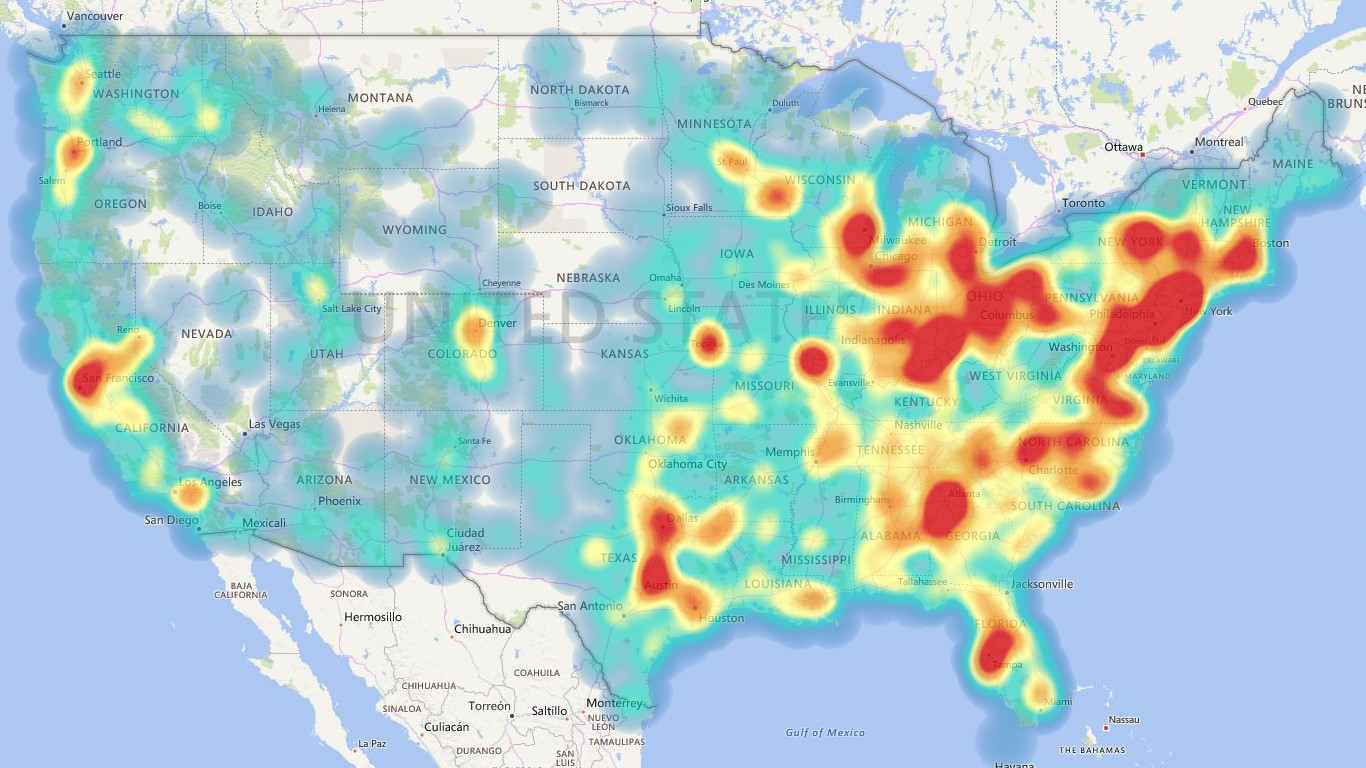
Us population density heat map - aholicmens
U.S. Population Density Map | Map, United States Map, Human Geography

U.S. Population Density Map | Map, United states map, Human geography
Us Map By Population Density

Us Map By Population Density
Population Density Map Of The Us - Map Of Rose Bowl
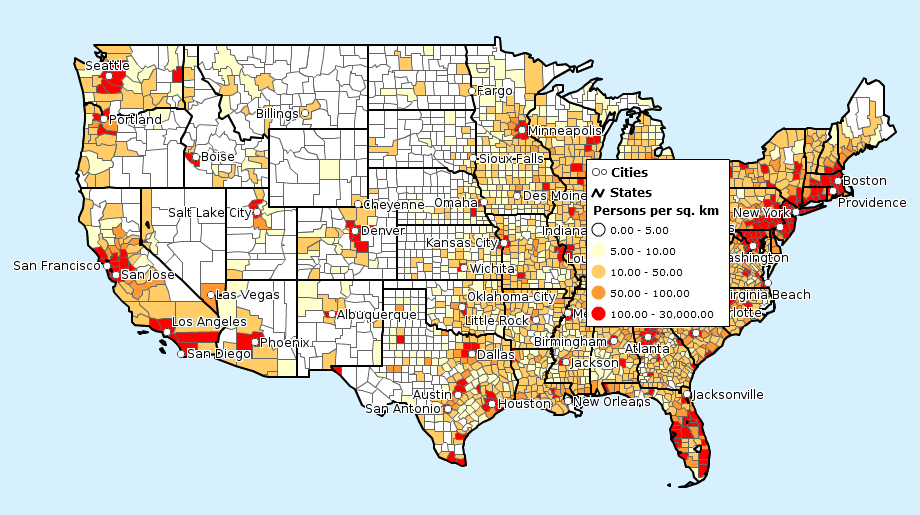
Population Density Map Of The Us - Map Of Rose Bowl
Map Of United States Population Density — Gridgrab

map of united states population density — Gridgrab
United States Population Density Map

United States Population Density Map
Us Map Population Density Capturing The Size And Density Of New York

Us Map Population Density Capturing The Size And Density Of New York
Us Population Density Heat Map – XFPU

Us Population Density Heat Map – XFPU
Data Visualization Heat Map Example - Population Density
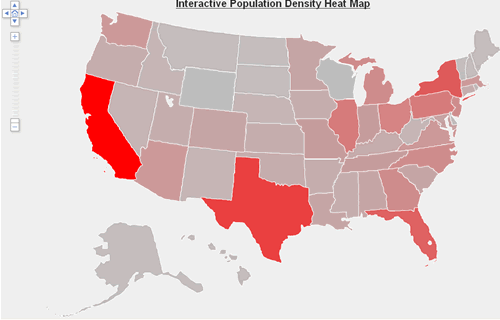
Data visualization heat map example - population density
Mapped: Population Density With A Dot For Each Town
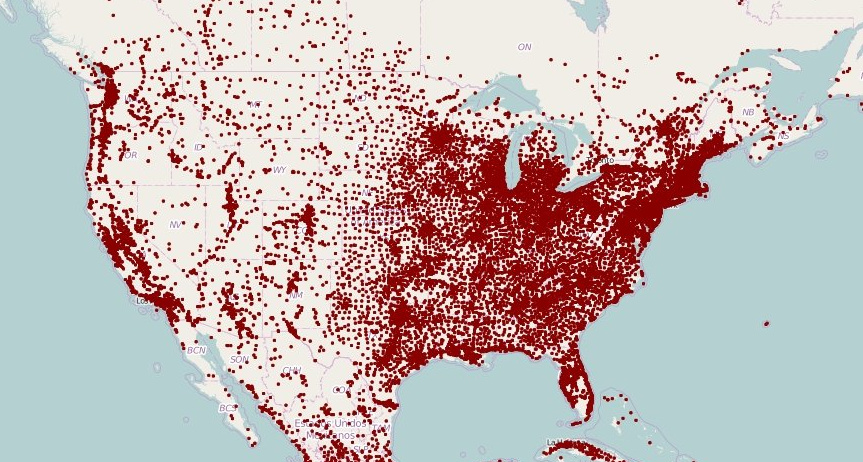
Mapped: Population Density With a Dot For Each Town
Atlanta Population Density Map 2000 Census And FHWA Adjusted Urbanised

Atlanta Population Density Map 2000 Census And FHWA Adjusted Urbanised
Population Density Us Interactive Map - Assefolio

Population density us interactive map - assefolio
U.S. Population Density Mapped - Vivid Maps

U.S. Population Density Mapped - Vivid Maps
Detailed Population Density Map Of The United States Highlighting Urban

Detailed Population Density Map of the United States Highlighting Urban ...
Us Population Heat Map _ Population Density – CDOBZY
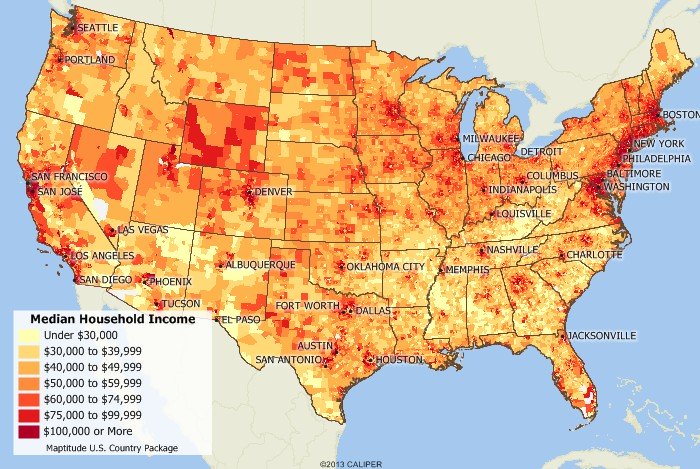
Us Population Heat Map _ Population density – CDOBZY
Us Population Density Heat Map - Infofity

Us population density heat map - infofity
Us Population Density Heat Map - Statviet
Us population density heat map - statviet
United States Population Density Map - All For One

United States Population Density Map - All For One
Us Population Density Heat Map – XFPU

Us Population Density Heat Map – XFPU
Population Size And Density Chart – OVNI

Population Size And Density Chart – OVNI
United States Population Density Map

United States Population Density Map
Population Density Map Of The Us - Map Of Rose Bowl

Population Density Map Of The Us - Map Of Rose Bowl
There's This Concept Called Population Density : R/TheRightCantMeme

There's This Concept Called Population Density : r/TheRightCantMeme
Population Density Map Of The Us - Map Of Rose Bowl
Population Density Map Of The Us - Map Of Rose Bowl
Usa Population Density Map

Usa Population Density Map
Us Population Density Map 2020 - Pdffeet

Us population density map 2020 - pdffeet
