US Population Concentration Map Reveals Dense Urban Centers and Sparse Rural Areas
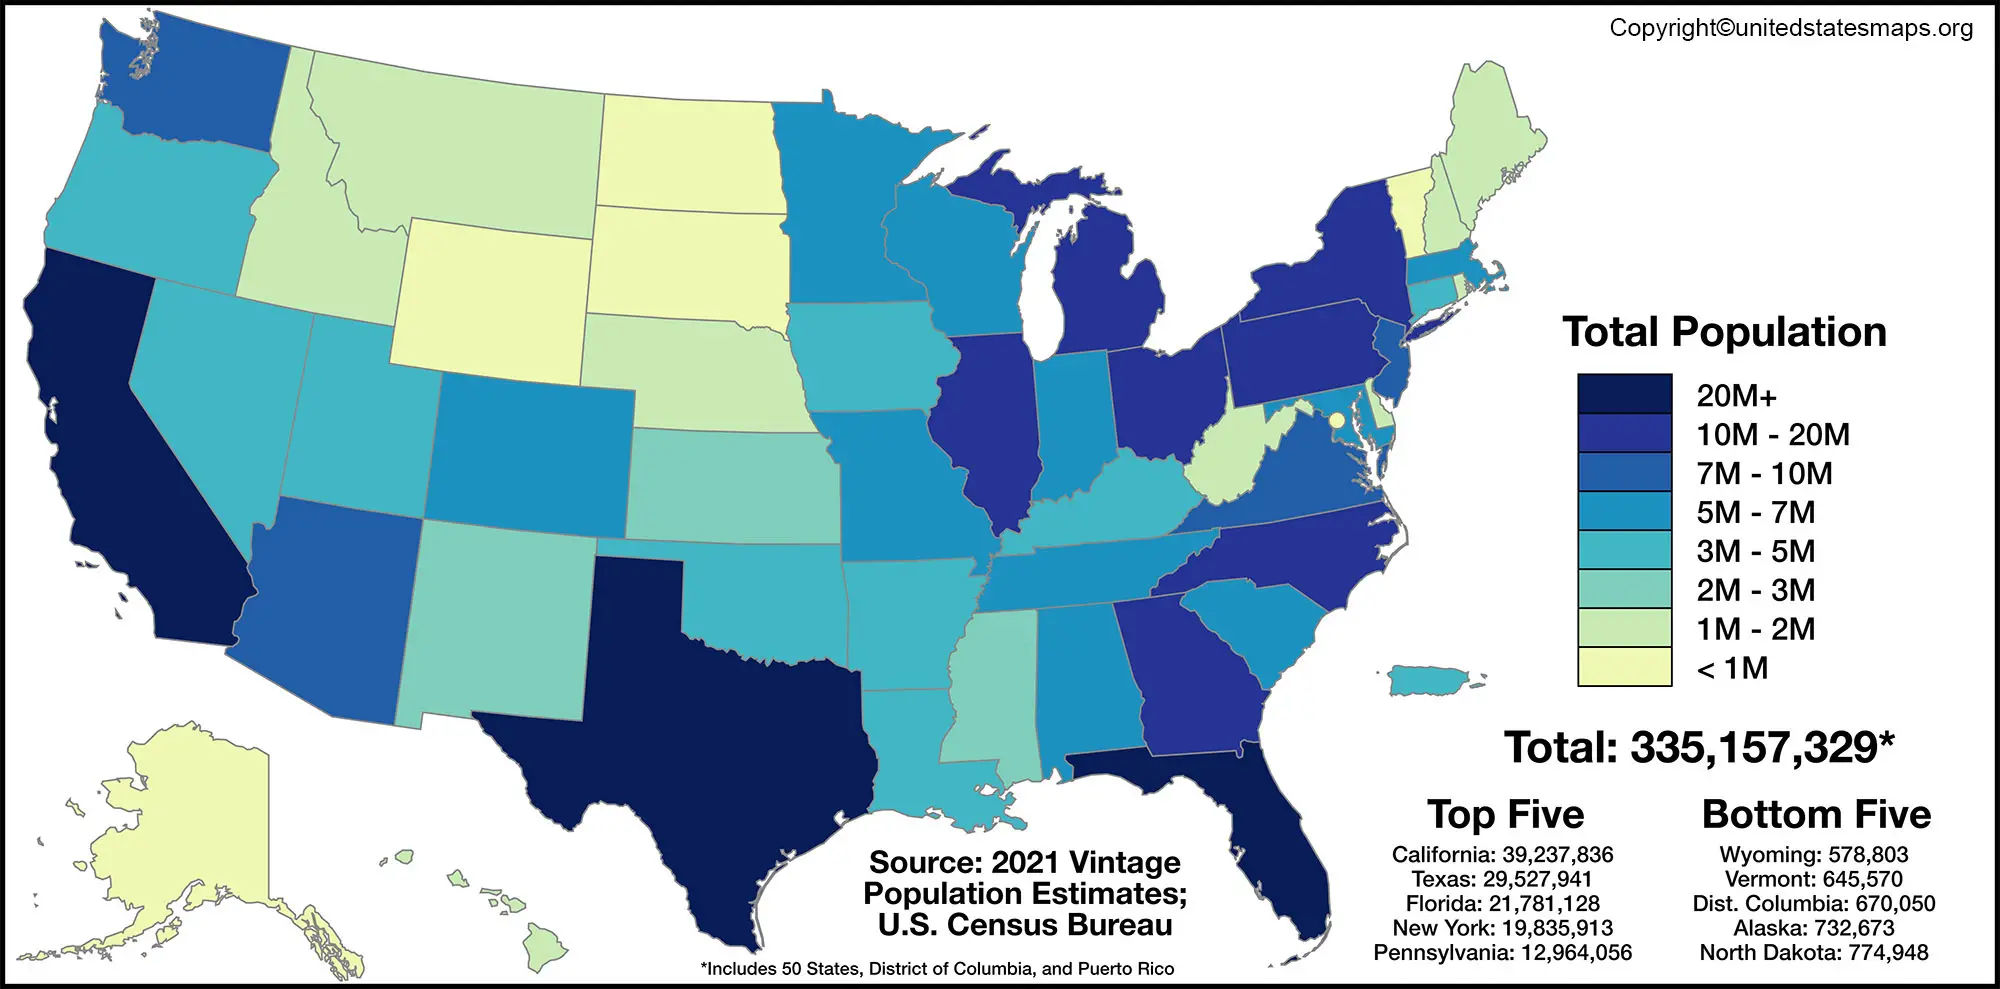
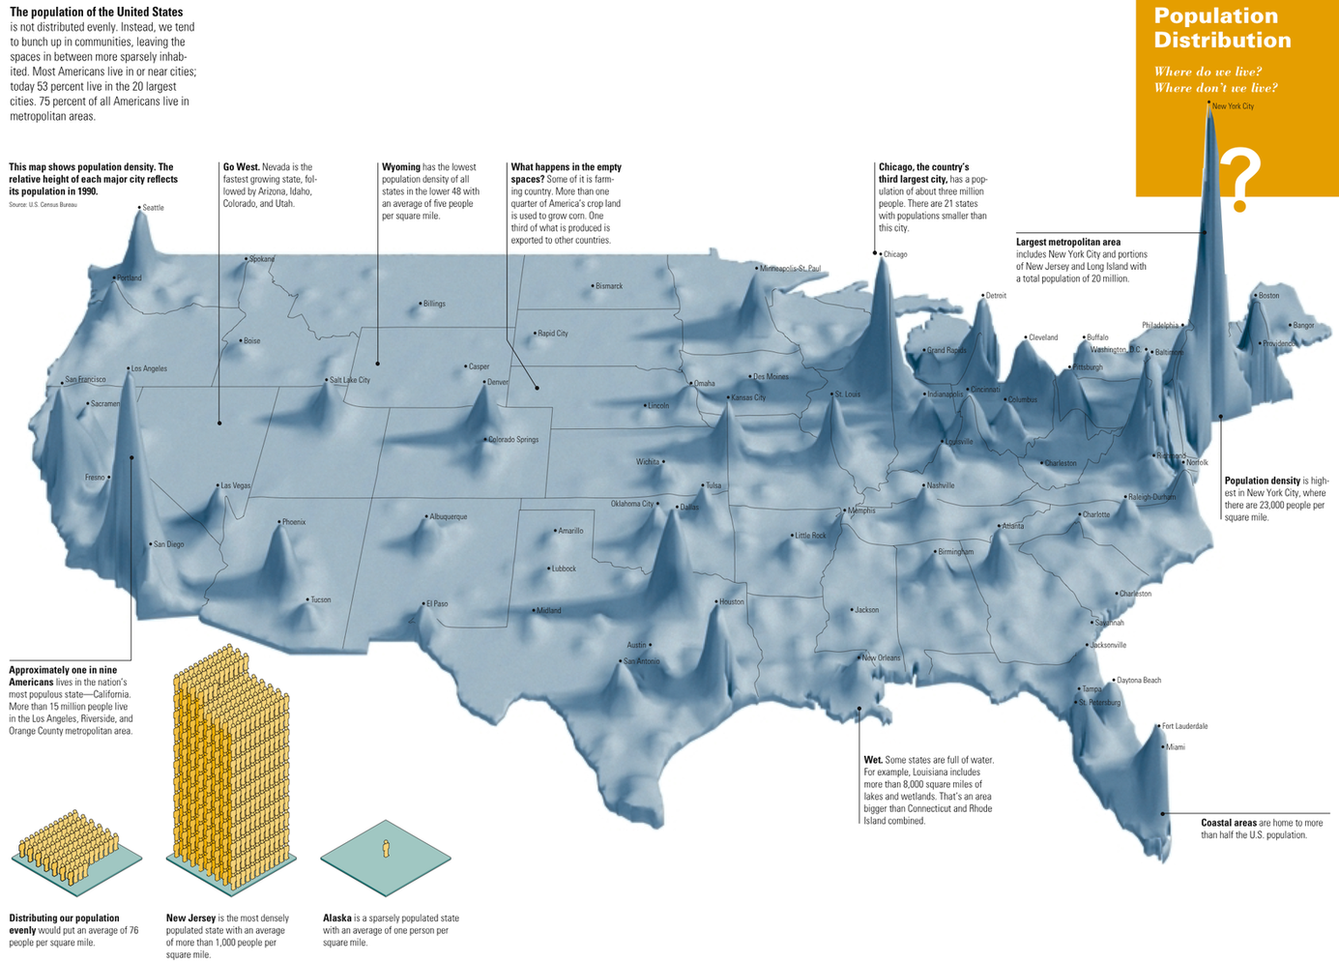
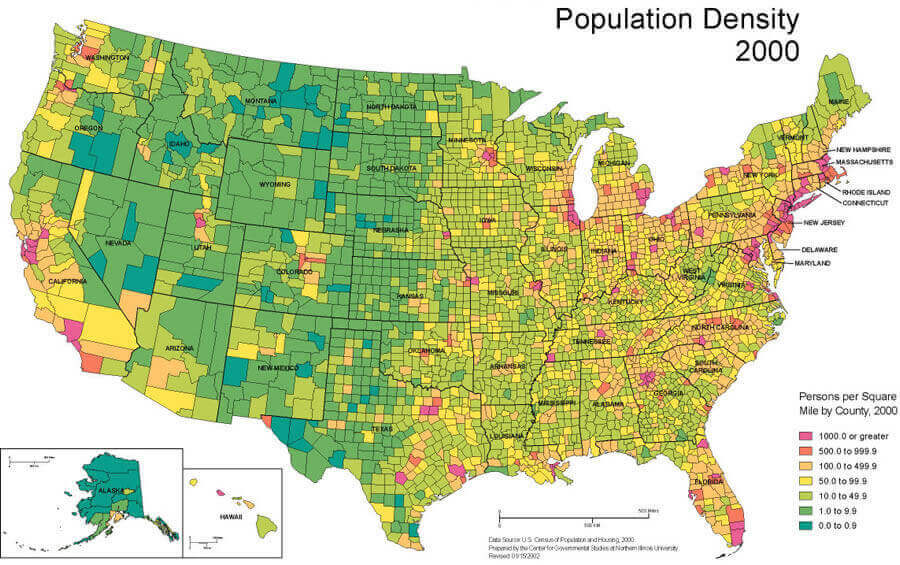
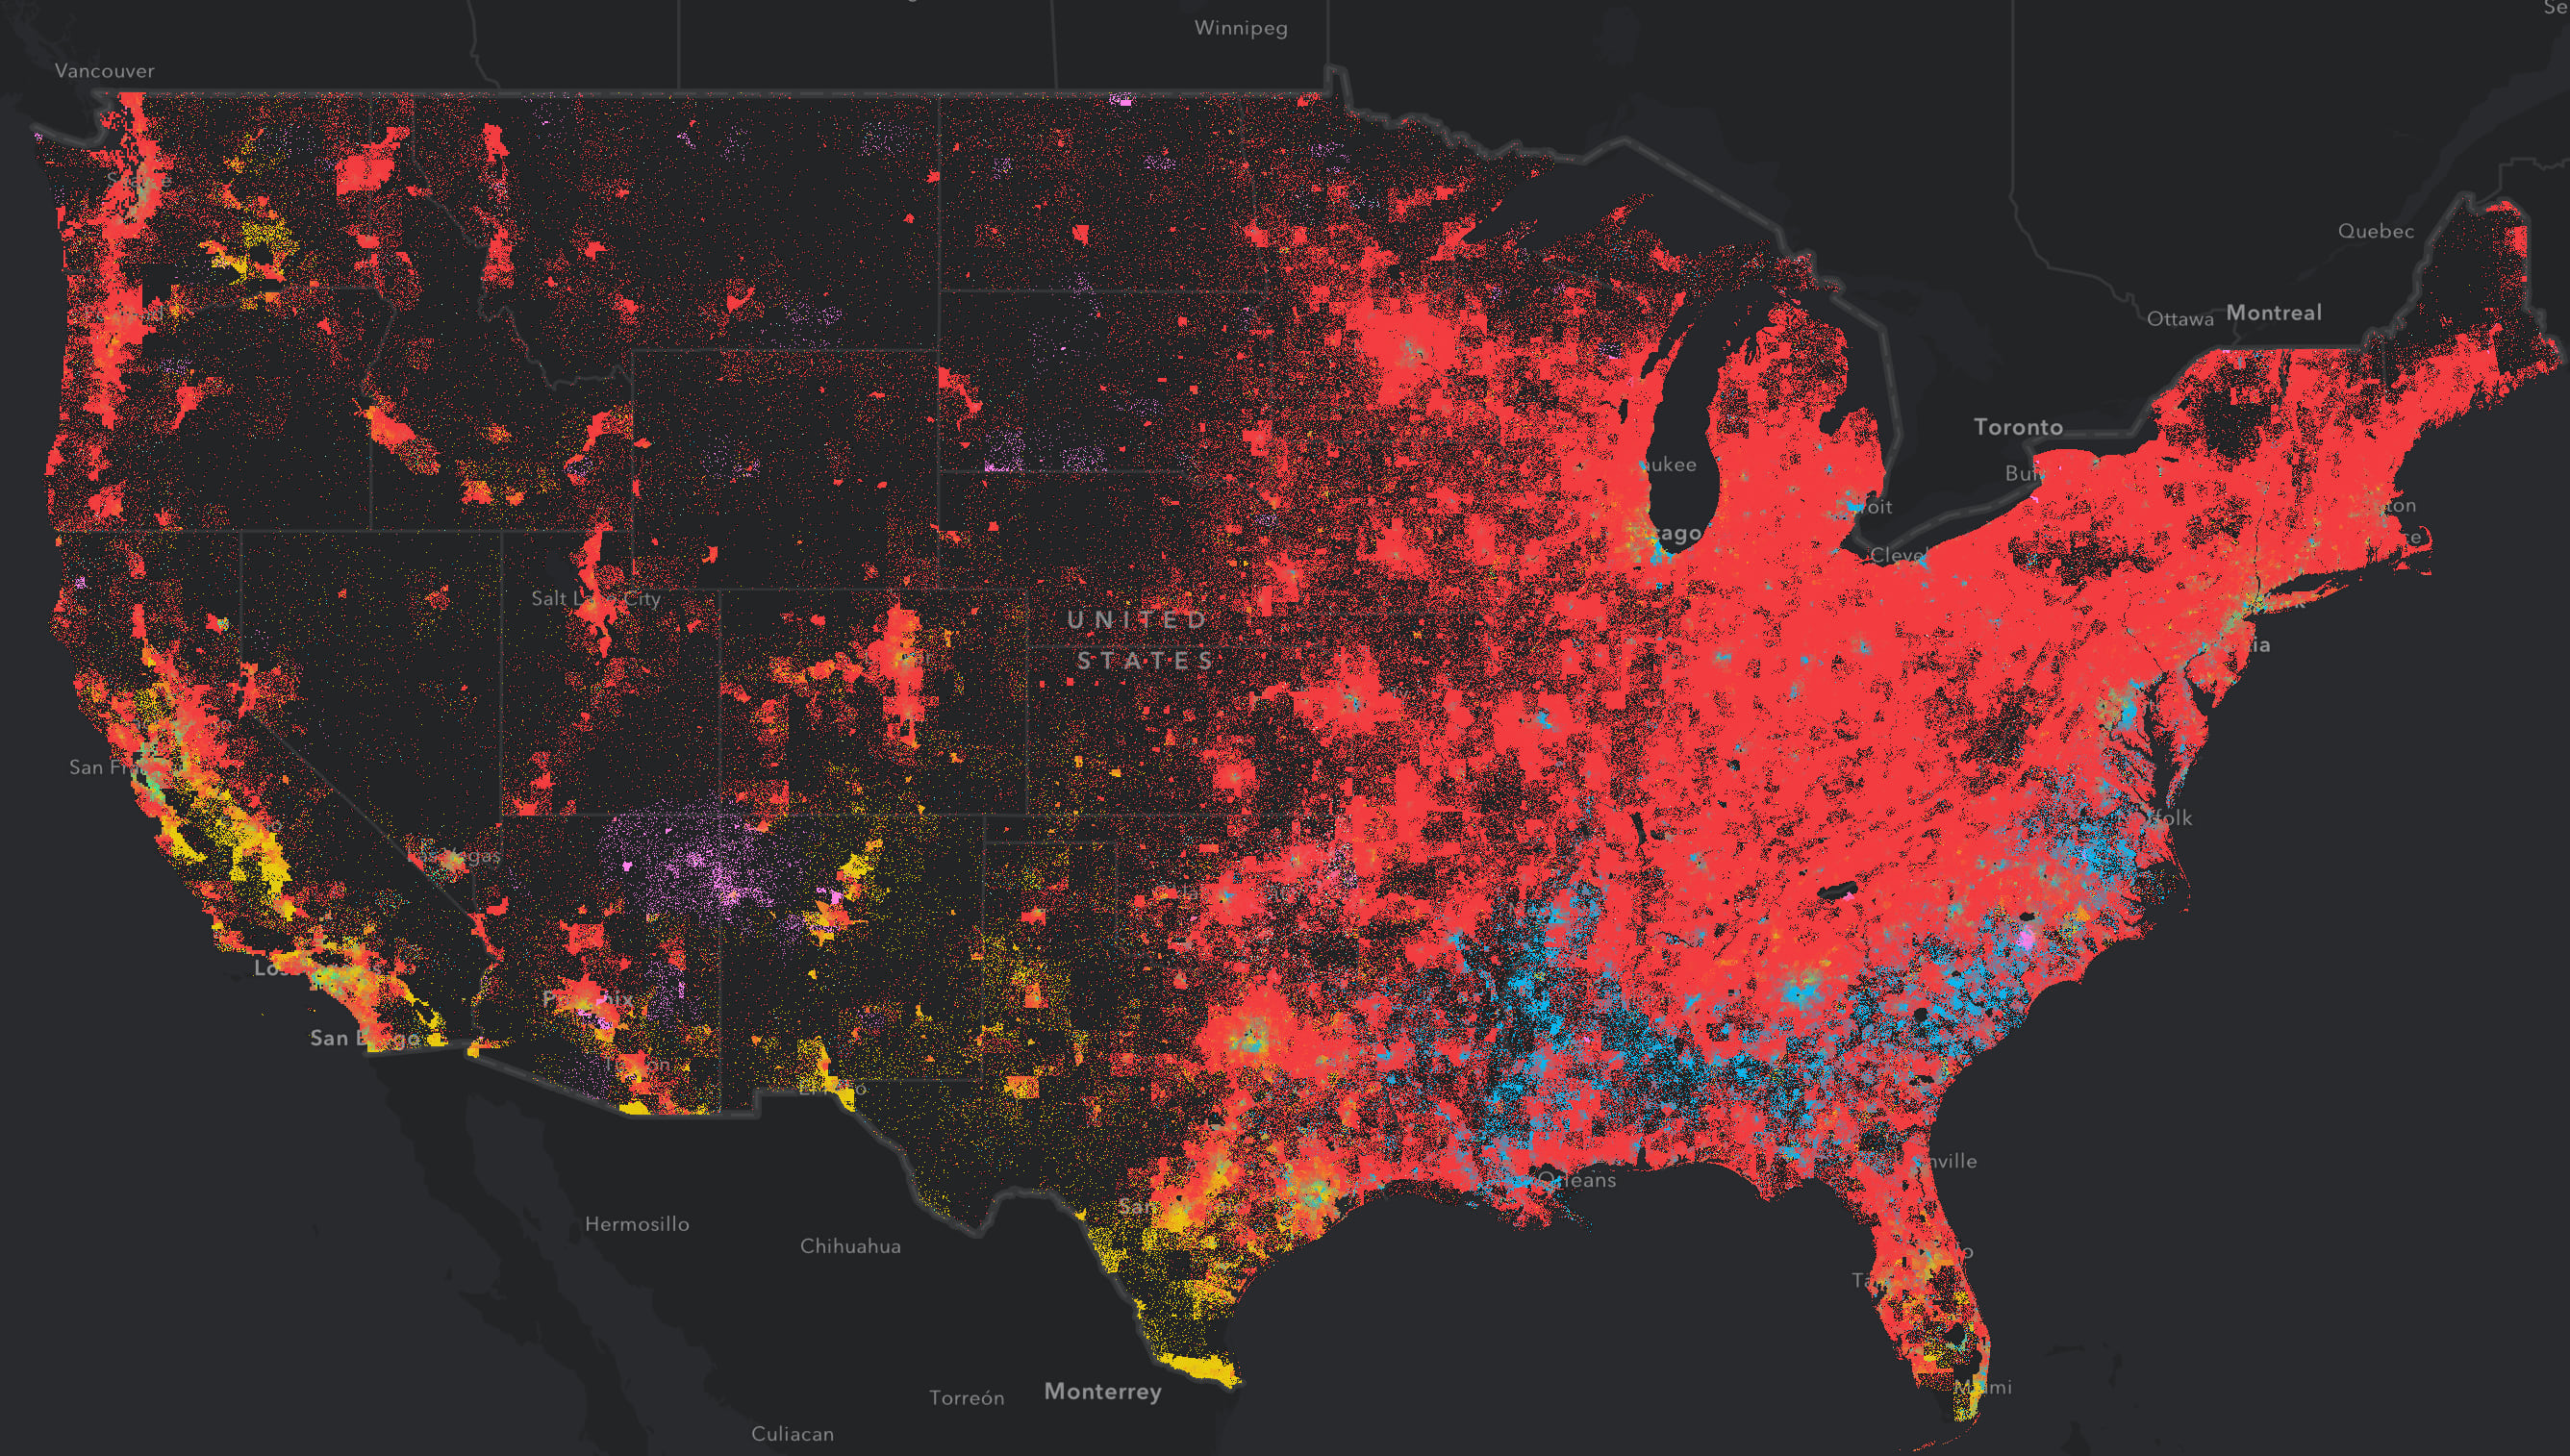
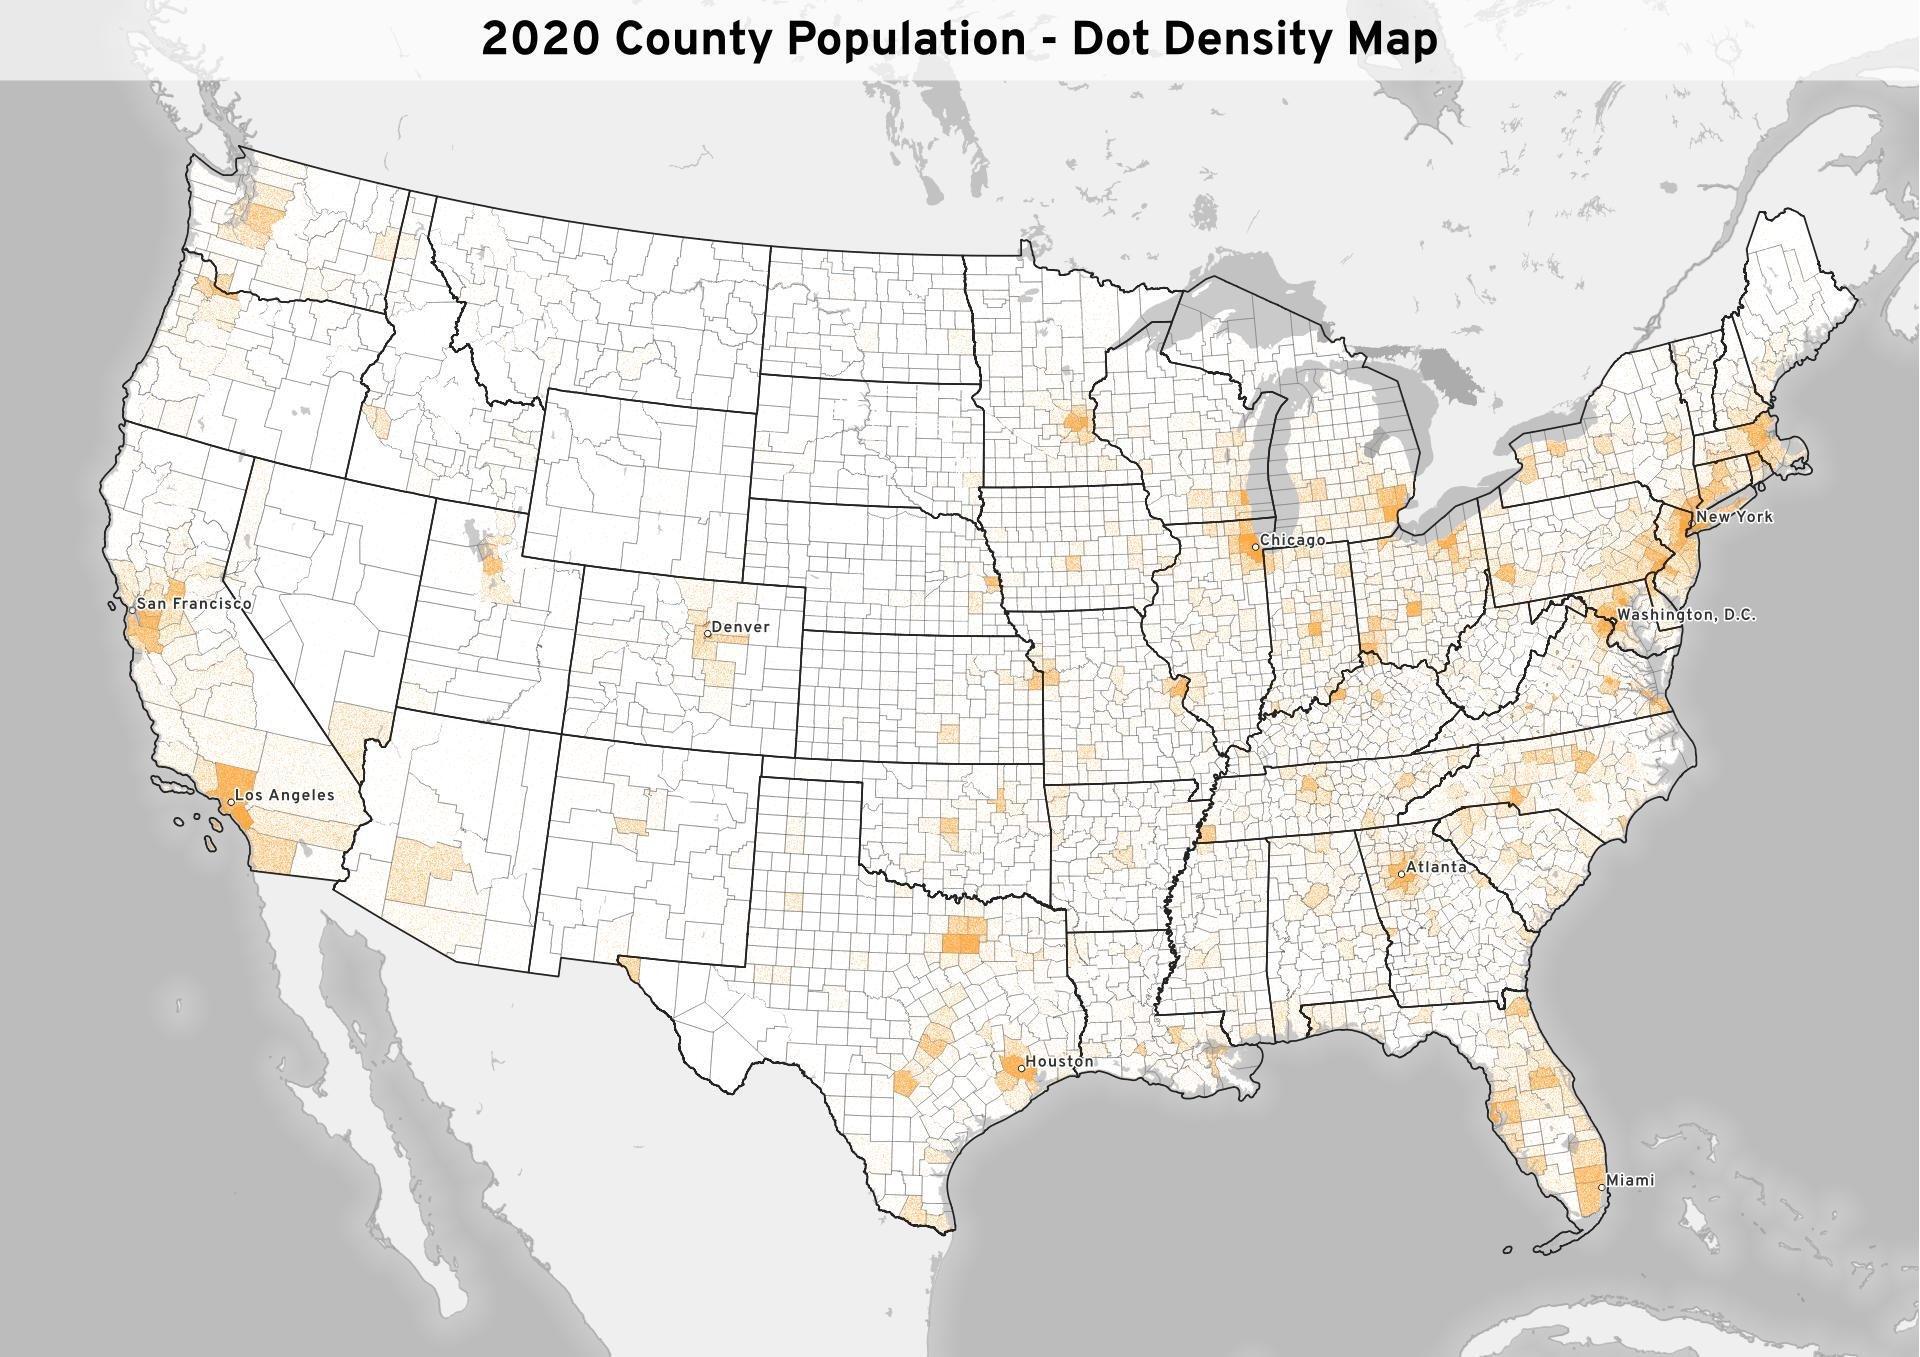
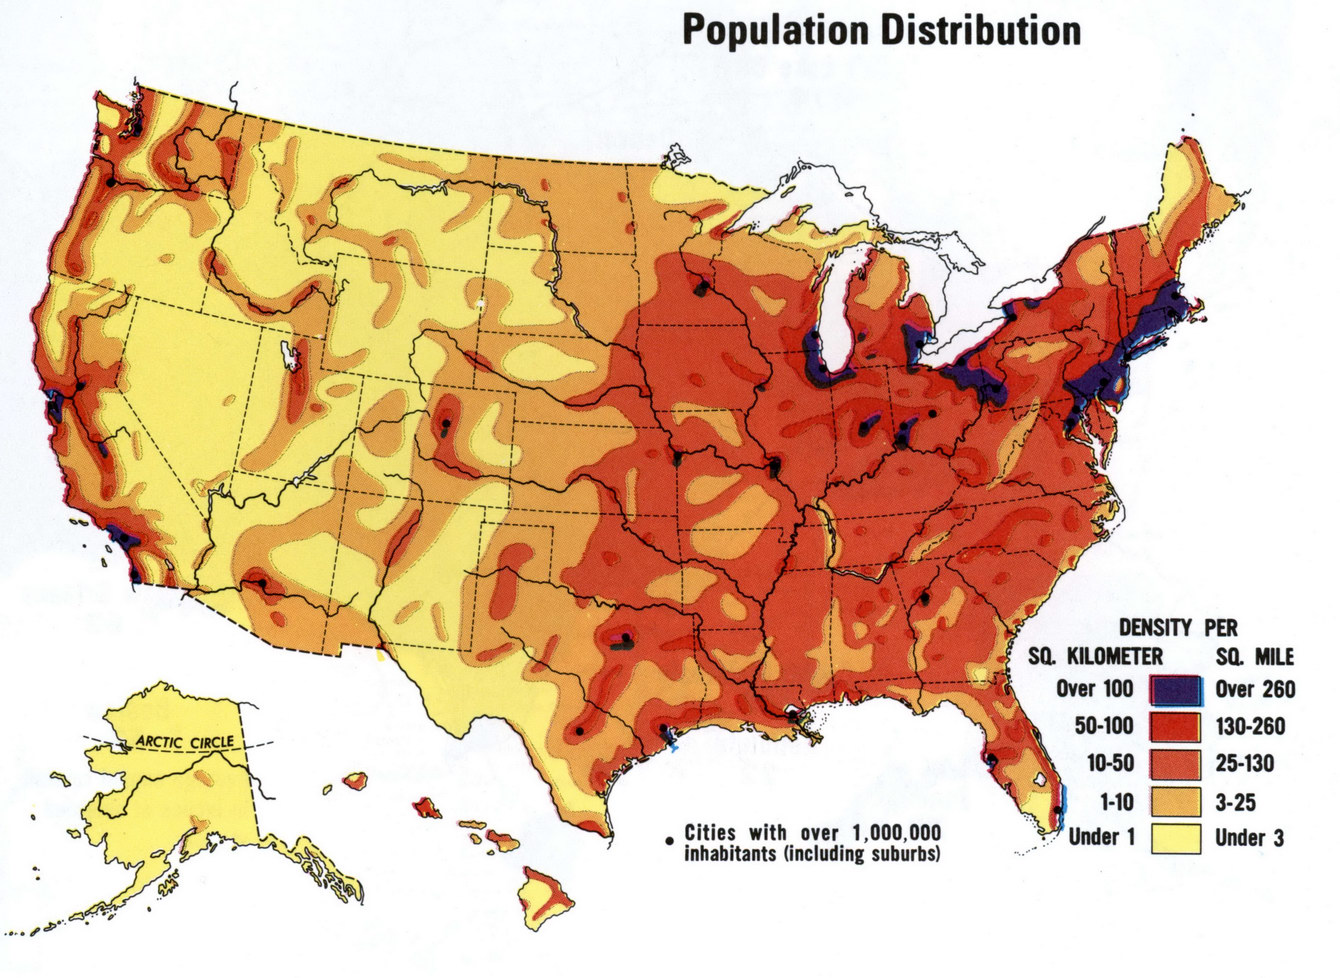
The latest population concentration map of the United States vividly illustrates how people are clustered in a handful of major metropolitan hubs while vast swaths of the country remain sparsely populated. According to the visual data, states such as California, Texas, New York, Florida, and Pennsylvania account for nearly half of the nation's 331 million residents, whereas large portions of the Midwest, Great Plains, and the interior West contain only a fraction of the population density shown in the graphic.
Population Distribution Highlights
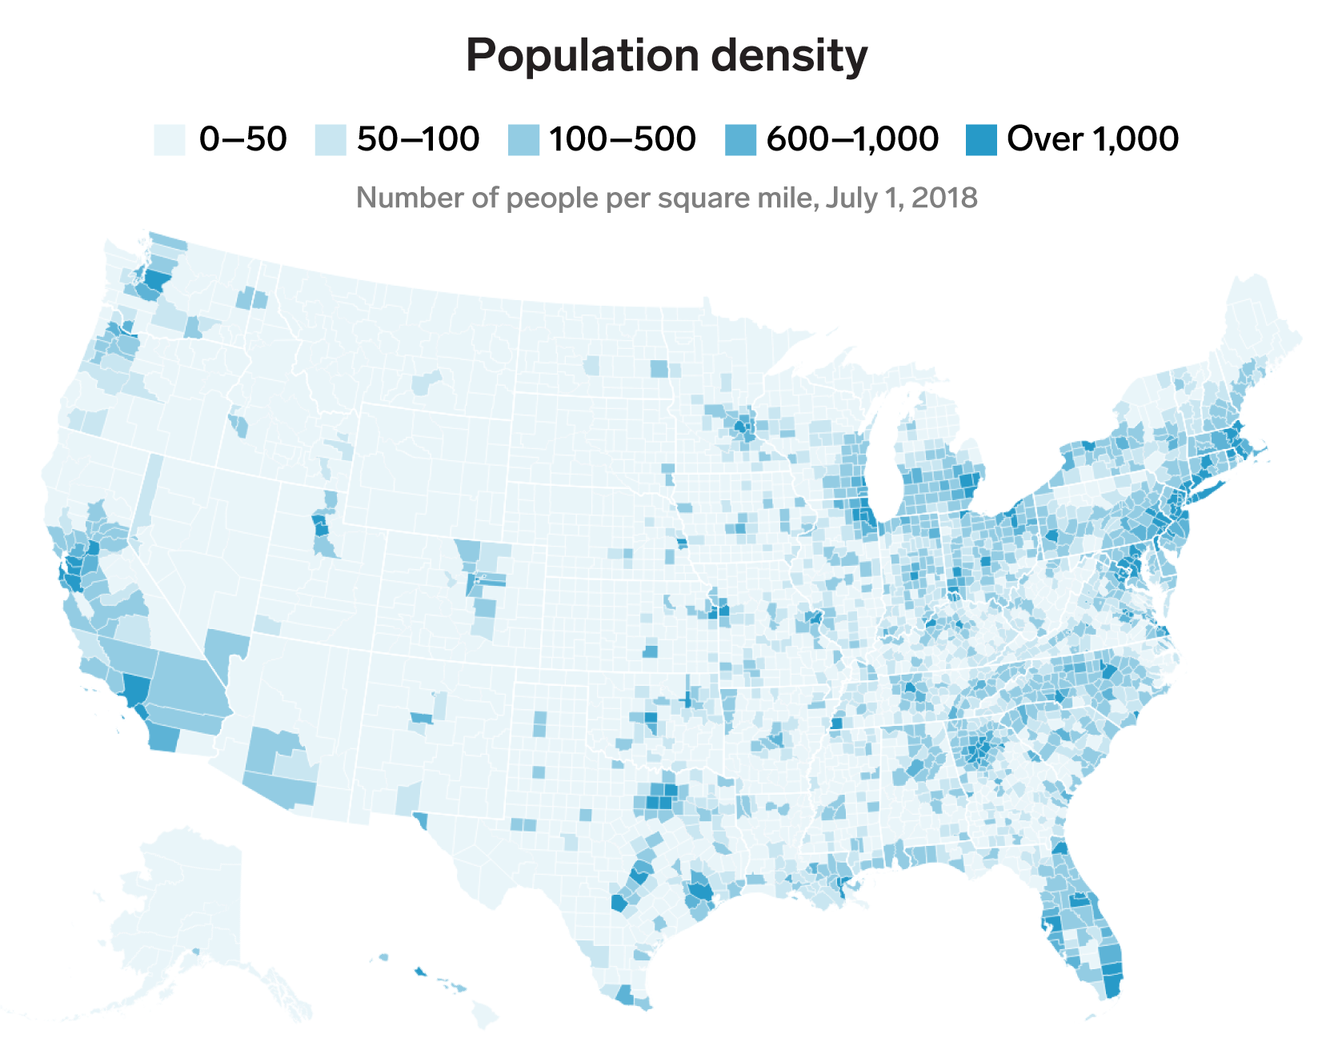
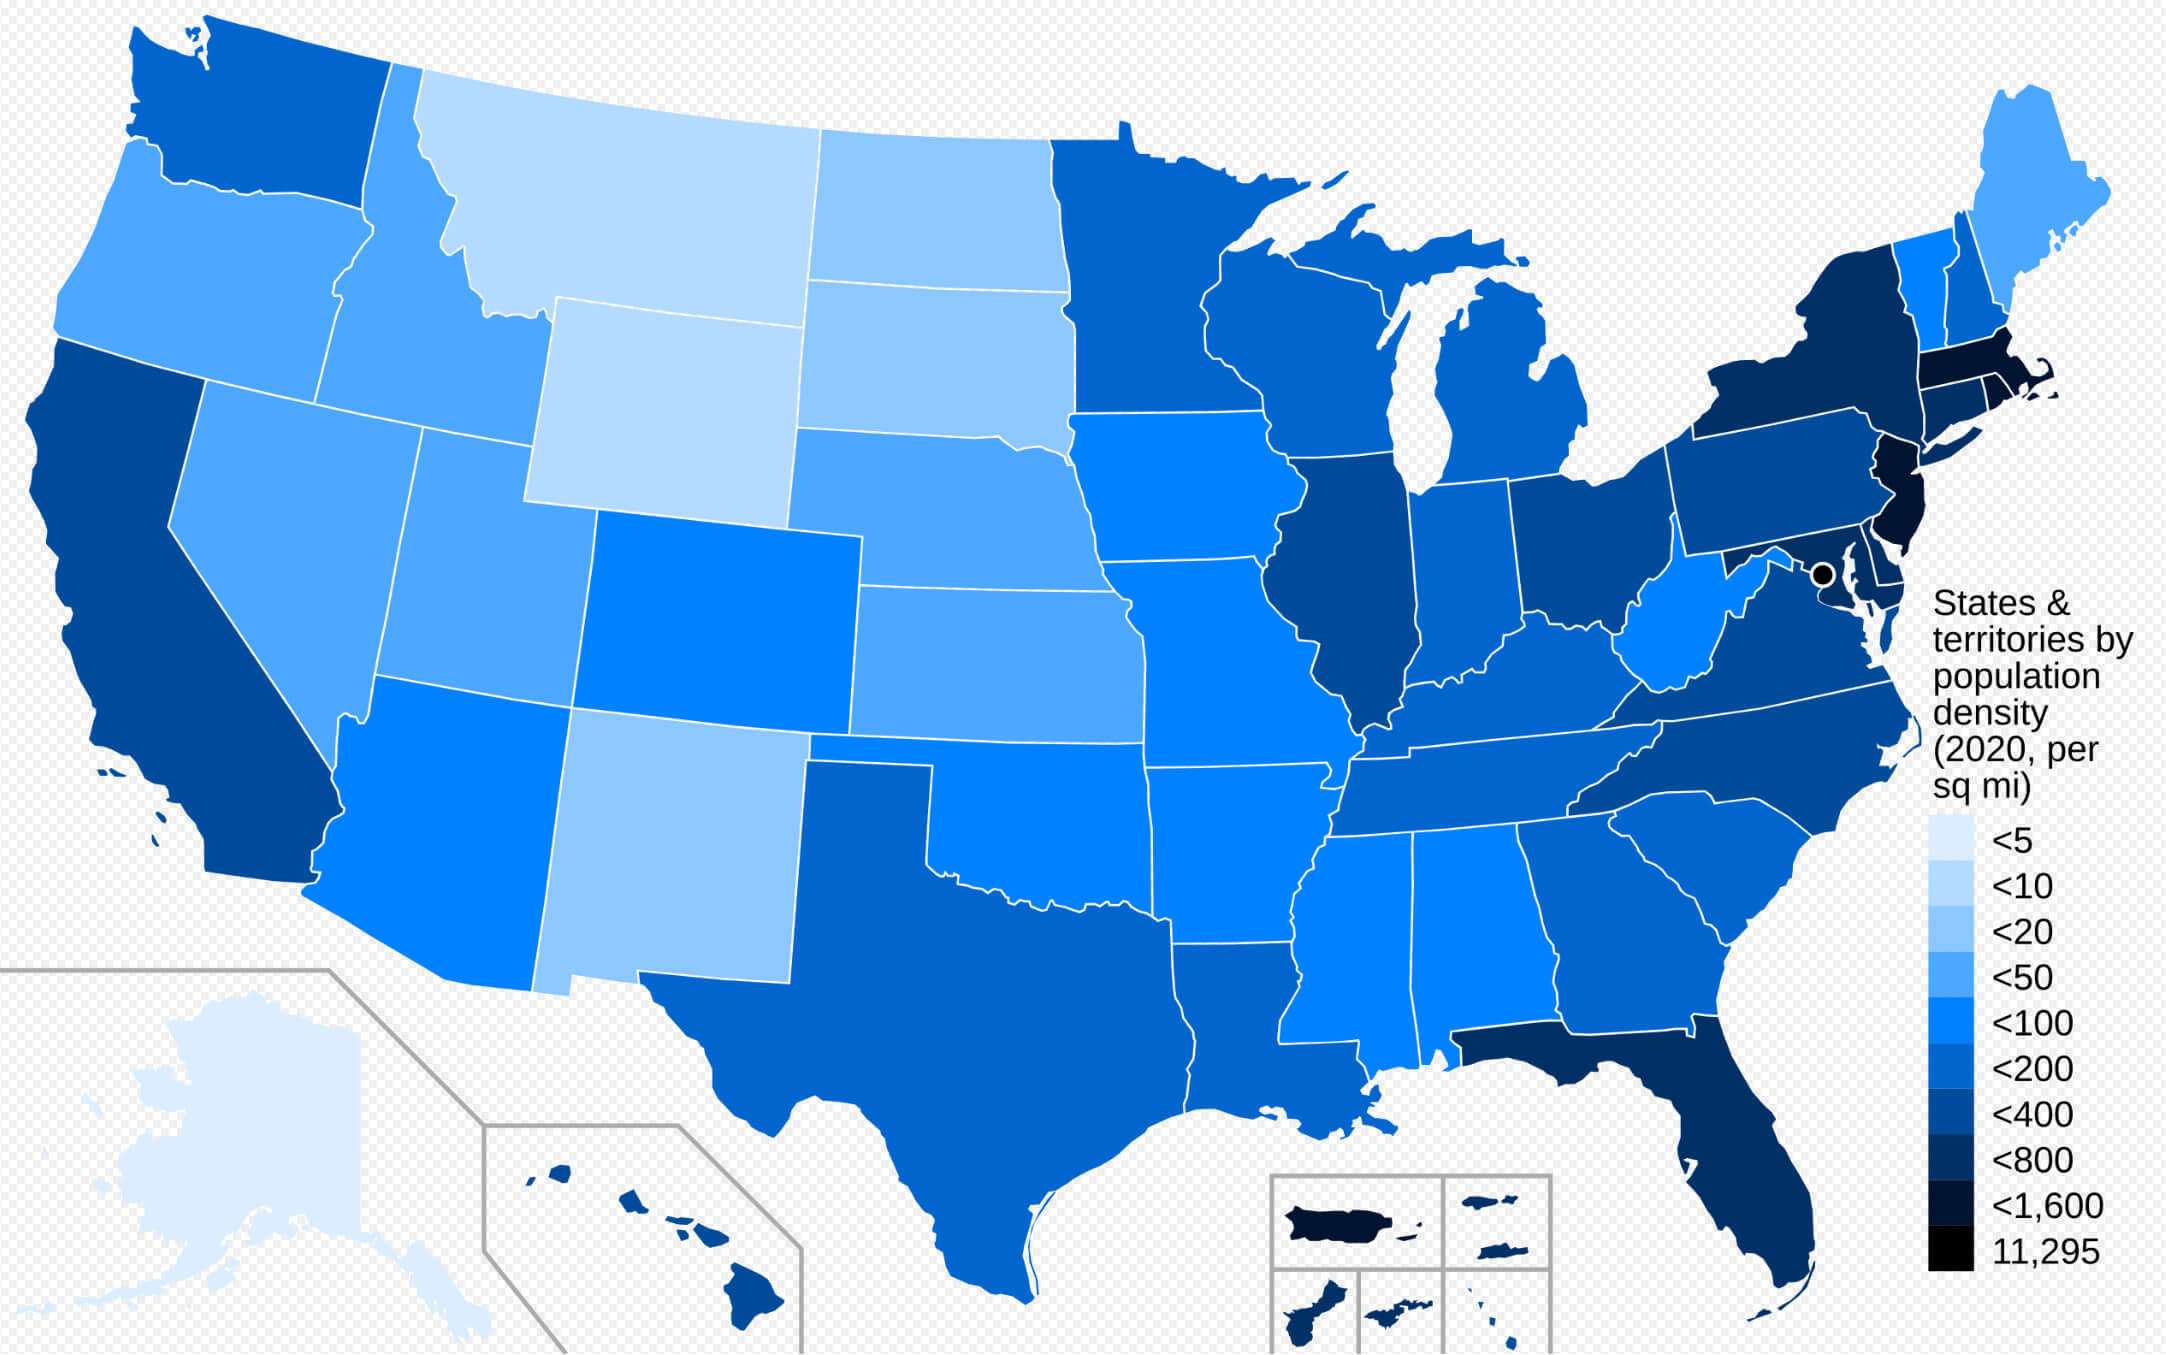
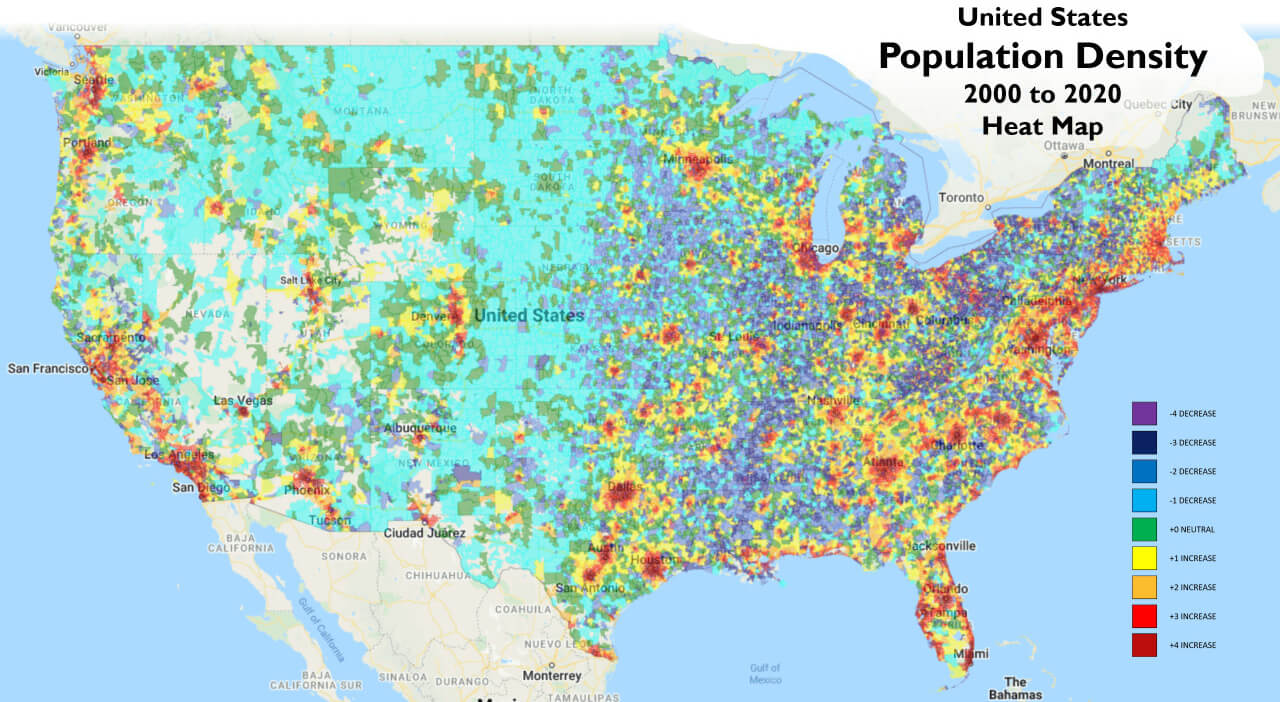
In the map, bright reds and oranges demarcate regions of high density—chiefly along the coasts and in the Southeast—where cities and suburbs create continuous corridors of habitation. Cooler blues and greens, in contrast, indicate areas of lower density, such as the Great Basin, the northern plains, and the central Appalachian region. The stark color contrast provides a quick visual cue to the uneven spread of people across the 50 states.
Urban Centers of Concentration
The map’s most densely populated clusters align with well-known urban areas. Los Angeles, New York City, Chicago, Houston, and Miami stand out as major hotspots, each surrounded by sprawling metropolitan regions that absorb commuters and support vast economies. The concentration of population in these centers fuels both economic opportunities and infrastructural demands, from transportation systems to housing markets.

Rural Population Decline
Conversely, the map underscores a persistent trend of rural depopulation. Large territories in states like Nebraska, Kansas, and Wyoming display muted coloration, reflecting fewer residents per square mile. These low-density areas face challenges such as limited access to healthcare, education, and economic diversification, while also experiencing slower population growth or even decline over recent decades.
Implications for Policy and Planning
Understanding the spatial distribution of people is critical for policymakers. High-density regions require expanded infrastructure, efficient public transportation, and affordable housing solutions to accommodate growing populations. In contrast, rural areas may benefit from targeted investment in digital connectivity and workforce development to reverse stagnation trends. Additionally, emergency services, environmental stewardship, and electoral representation all hinge on accurately interpreting population maps to allocate resources fairly and effectively across the nation.
Us Population Density Interactive Map - Docuasse
Us population density interactive map - docuasse
Population Size, Distribution And Concentration | SpringerLink

Population Size, Distribution and Concentration | SpringerLink
US Population Map - Guide Of The World

US Population Map - Guide of the World
U.S. Population Density Mapped - Vivid Maps

U.S. Population Density Mapped - Vivid Maps
Detailed Population Density Map Of The United States Highlighting Urban

Detailed Population Density Map of the United States Highlighting Urban ...
Us Population Density Map : Us Census Data Is Available Down To The
Us Population Density Map : Us census data is available down to the ...
United States Population Density Map

United States Population Density Map
United States Population Density Map 2022

United States Population Density Map 2022
Us Map Showing Population US Population Growth Smallest In At Least

Us Map Showing Population US Population Growth Smallest In At Least
US Population Map - Guide Of The World
US Population Map - Guide of the World
United States Population Map - Guide Of The World
United States Population Map - Guide of the World
Us Population Density Map 2022

Us Population Density Map 2022
Us Map Population Density Capturing The Size And Density Of New York

Us Map Population Density Capturing The Size And Density Of New York
Us Population Density Map : Us Census Data Is Available Down To The
Us Population Density Map : Us census data is available down to the ...
United States Population Density Map 2022

United States Population Density Map 2022
United States Population Density Map - All For One

United States Population Density Map - All For One
Map Of The Us By Population Watch The U.S. Population Grow Over Time

Map Of The Us By Population Watch The U.S. Population Grow Over Time
United States Population Density Map
United States Population Density Map
Population Density Map Of The Us - Map Of Rose Bowl

Population Density Map Of The Us - Map Of Rose Bowl
Us Population Density Map 2020 - Pdffeet

Us population density map 2020 - pdffeet
Us Population Density Heat Map – XFPU

Us Population Density Heat Map – XFPU
Usa Population Density Map
Usa Population Density Map
Us Population Density Heat Map - Statviet
Us population density heat map - statviet
United States Population Density Map 2022

United States Population Density Map 2022
USA Population Density Map Free Large Scale United States - US Map
USA Population density map free large scale United States - US map
