US Population and Density Trends: What the Maps Reveal
The United States currently hosts a population of roughly 335 million people, yet the distribution of residents across the 3.8 million square miles of land is far from uniform. While urban centers such as New York City, Los Angeles, and Chicago pack millions into a few hundred square miles, vast stretches of the Midwest, West, and South remain sparsely populated. These disparities have significant implications for transportation, resource allocation, and political representation.
Context
Over the past century, the U.S. has experienced steady population growth driven by natural increase and international immigration. According to the latest Census Bureau estimates, the population grew by 0.7% in 2023, a slower pace than the 4.5% growth observed in the 1950s. However, the growth is uneven; the West and Northeast have seen higher rates due to economic opportunities and climate preferences. The resulting density patterns—measured in residents per square mile—highlight a pronounced urban-rural divide, with metropolitan regions averaging over 1,000 residents per square mile while rural counties average fewer than 30. 
Details
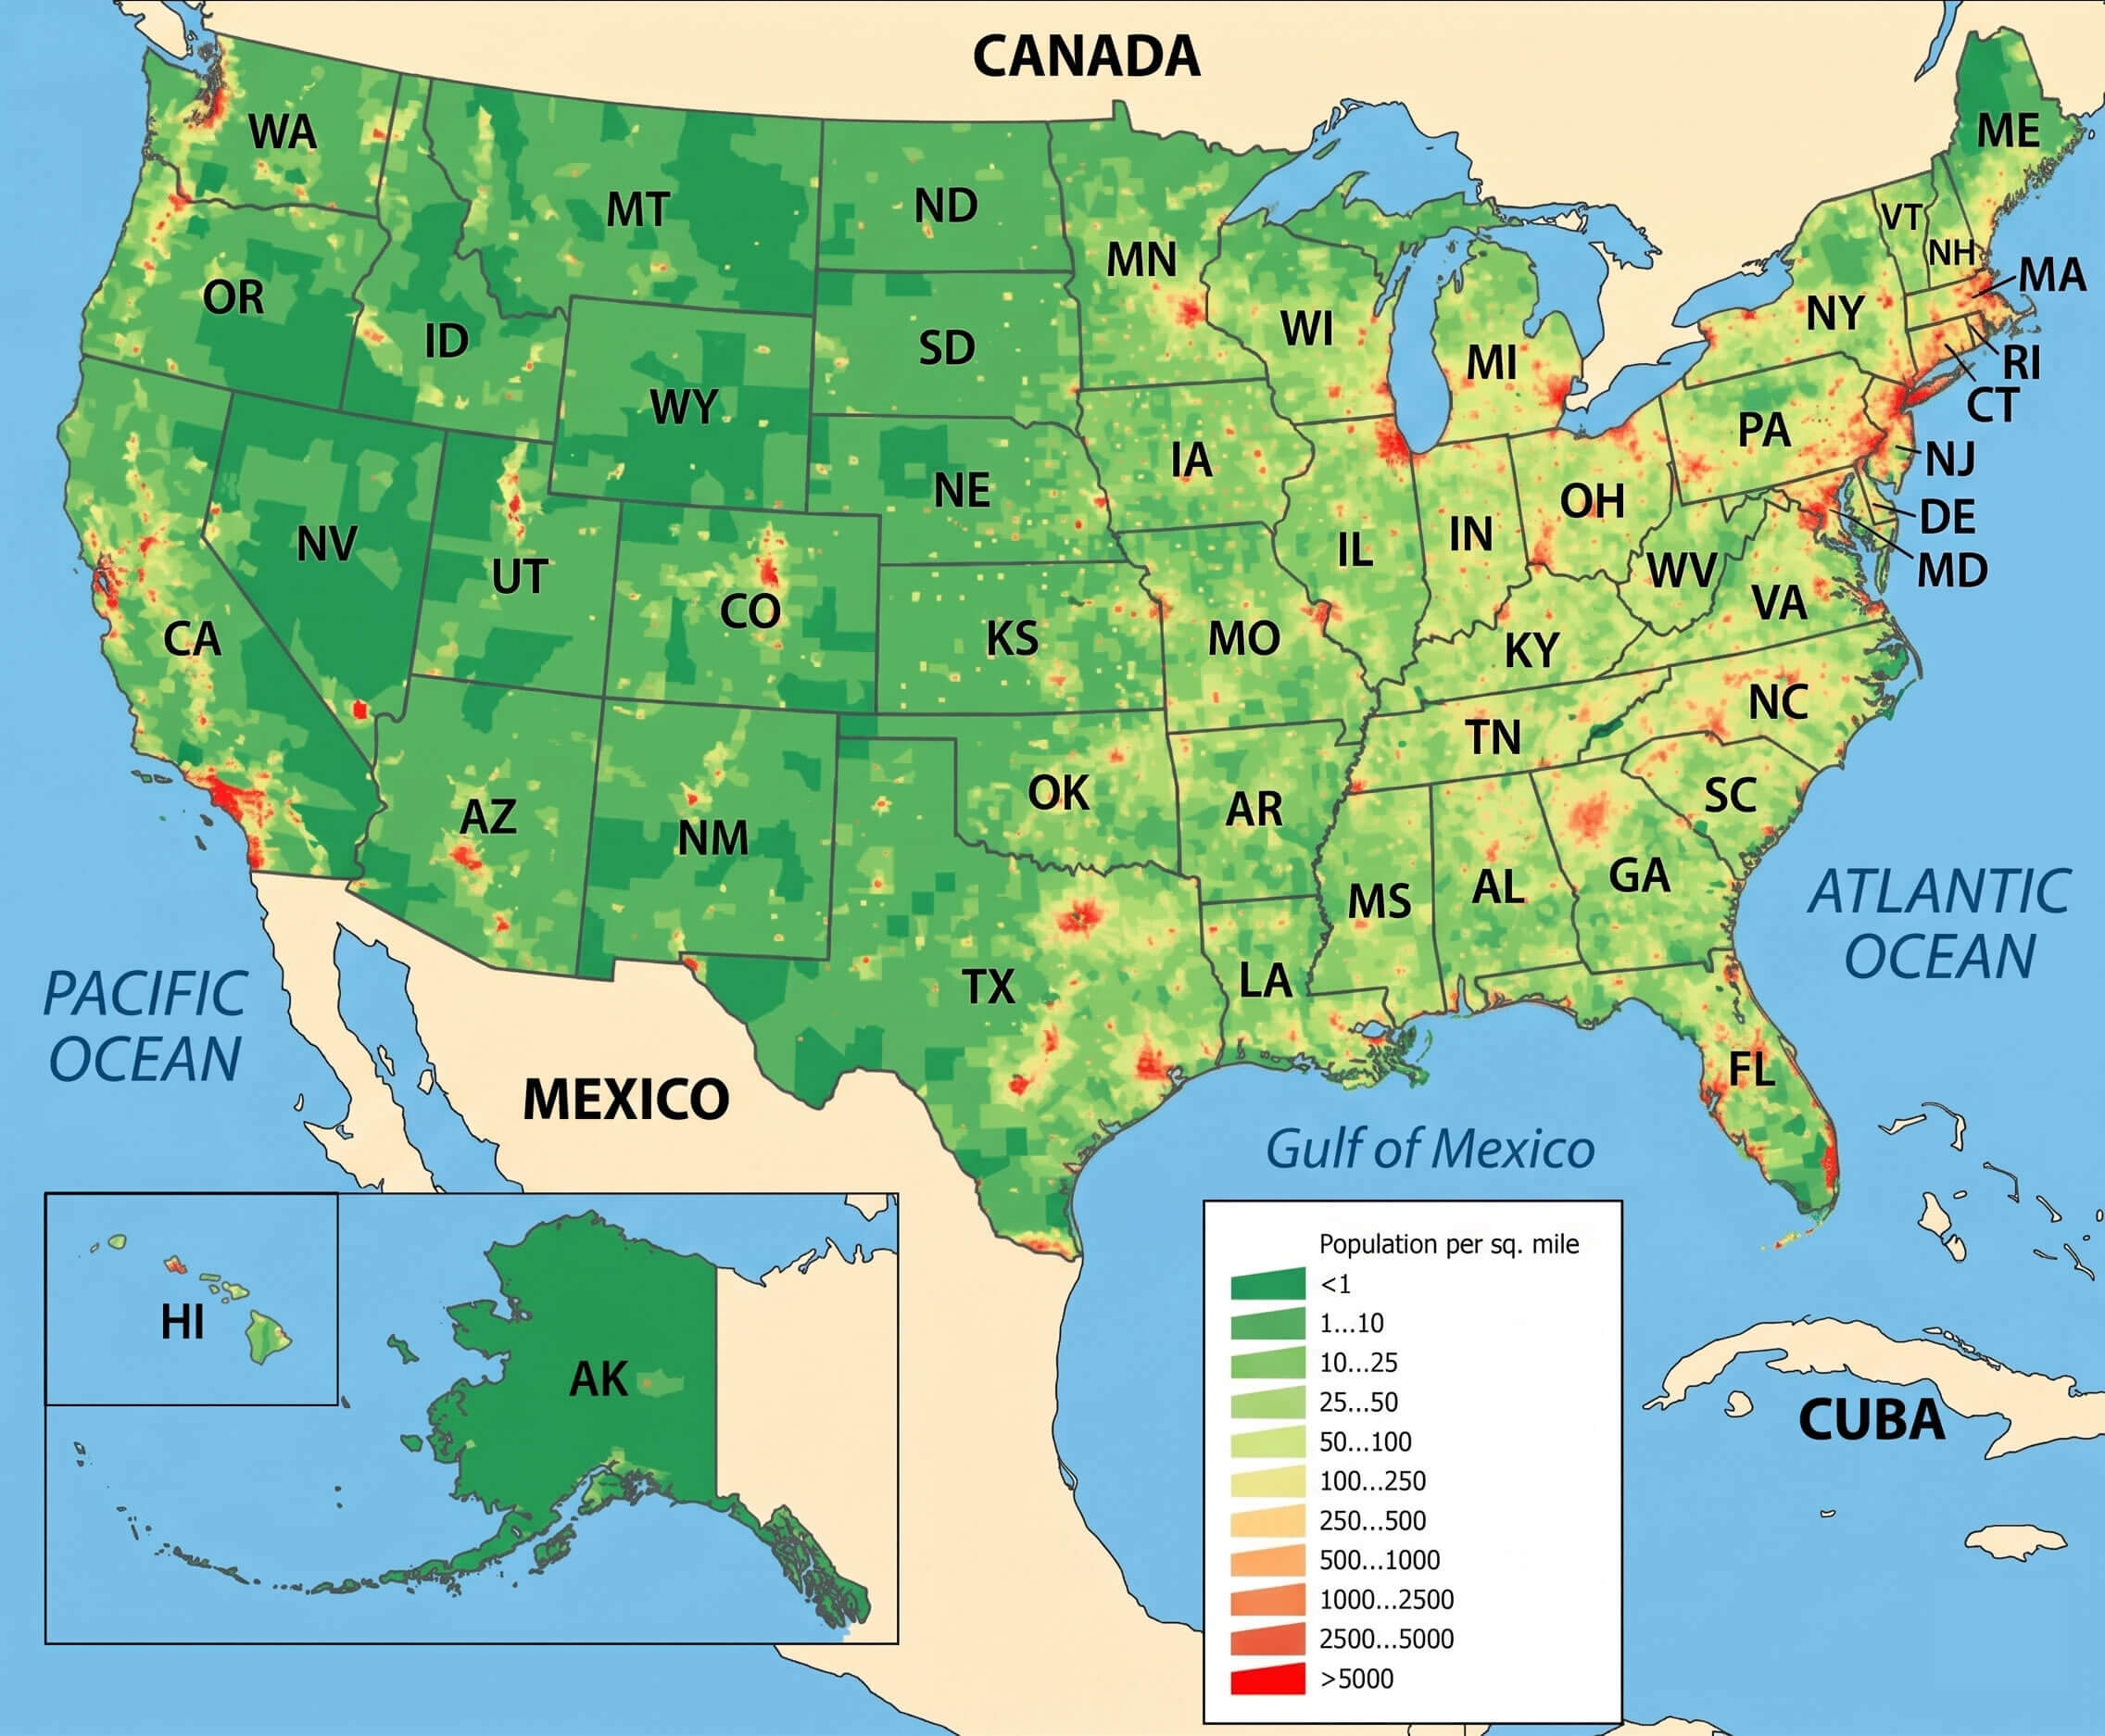
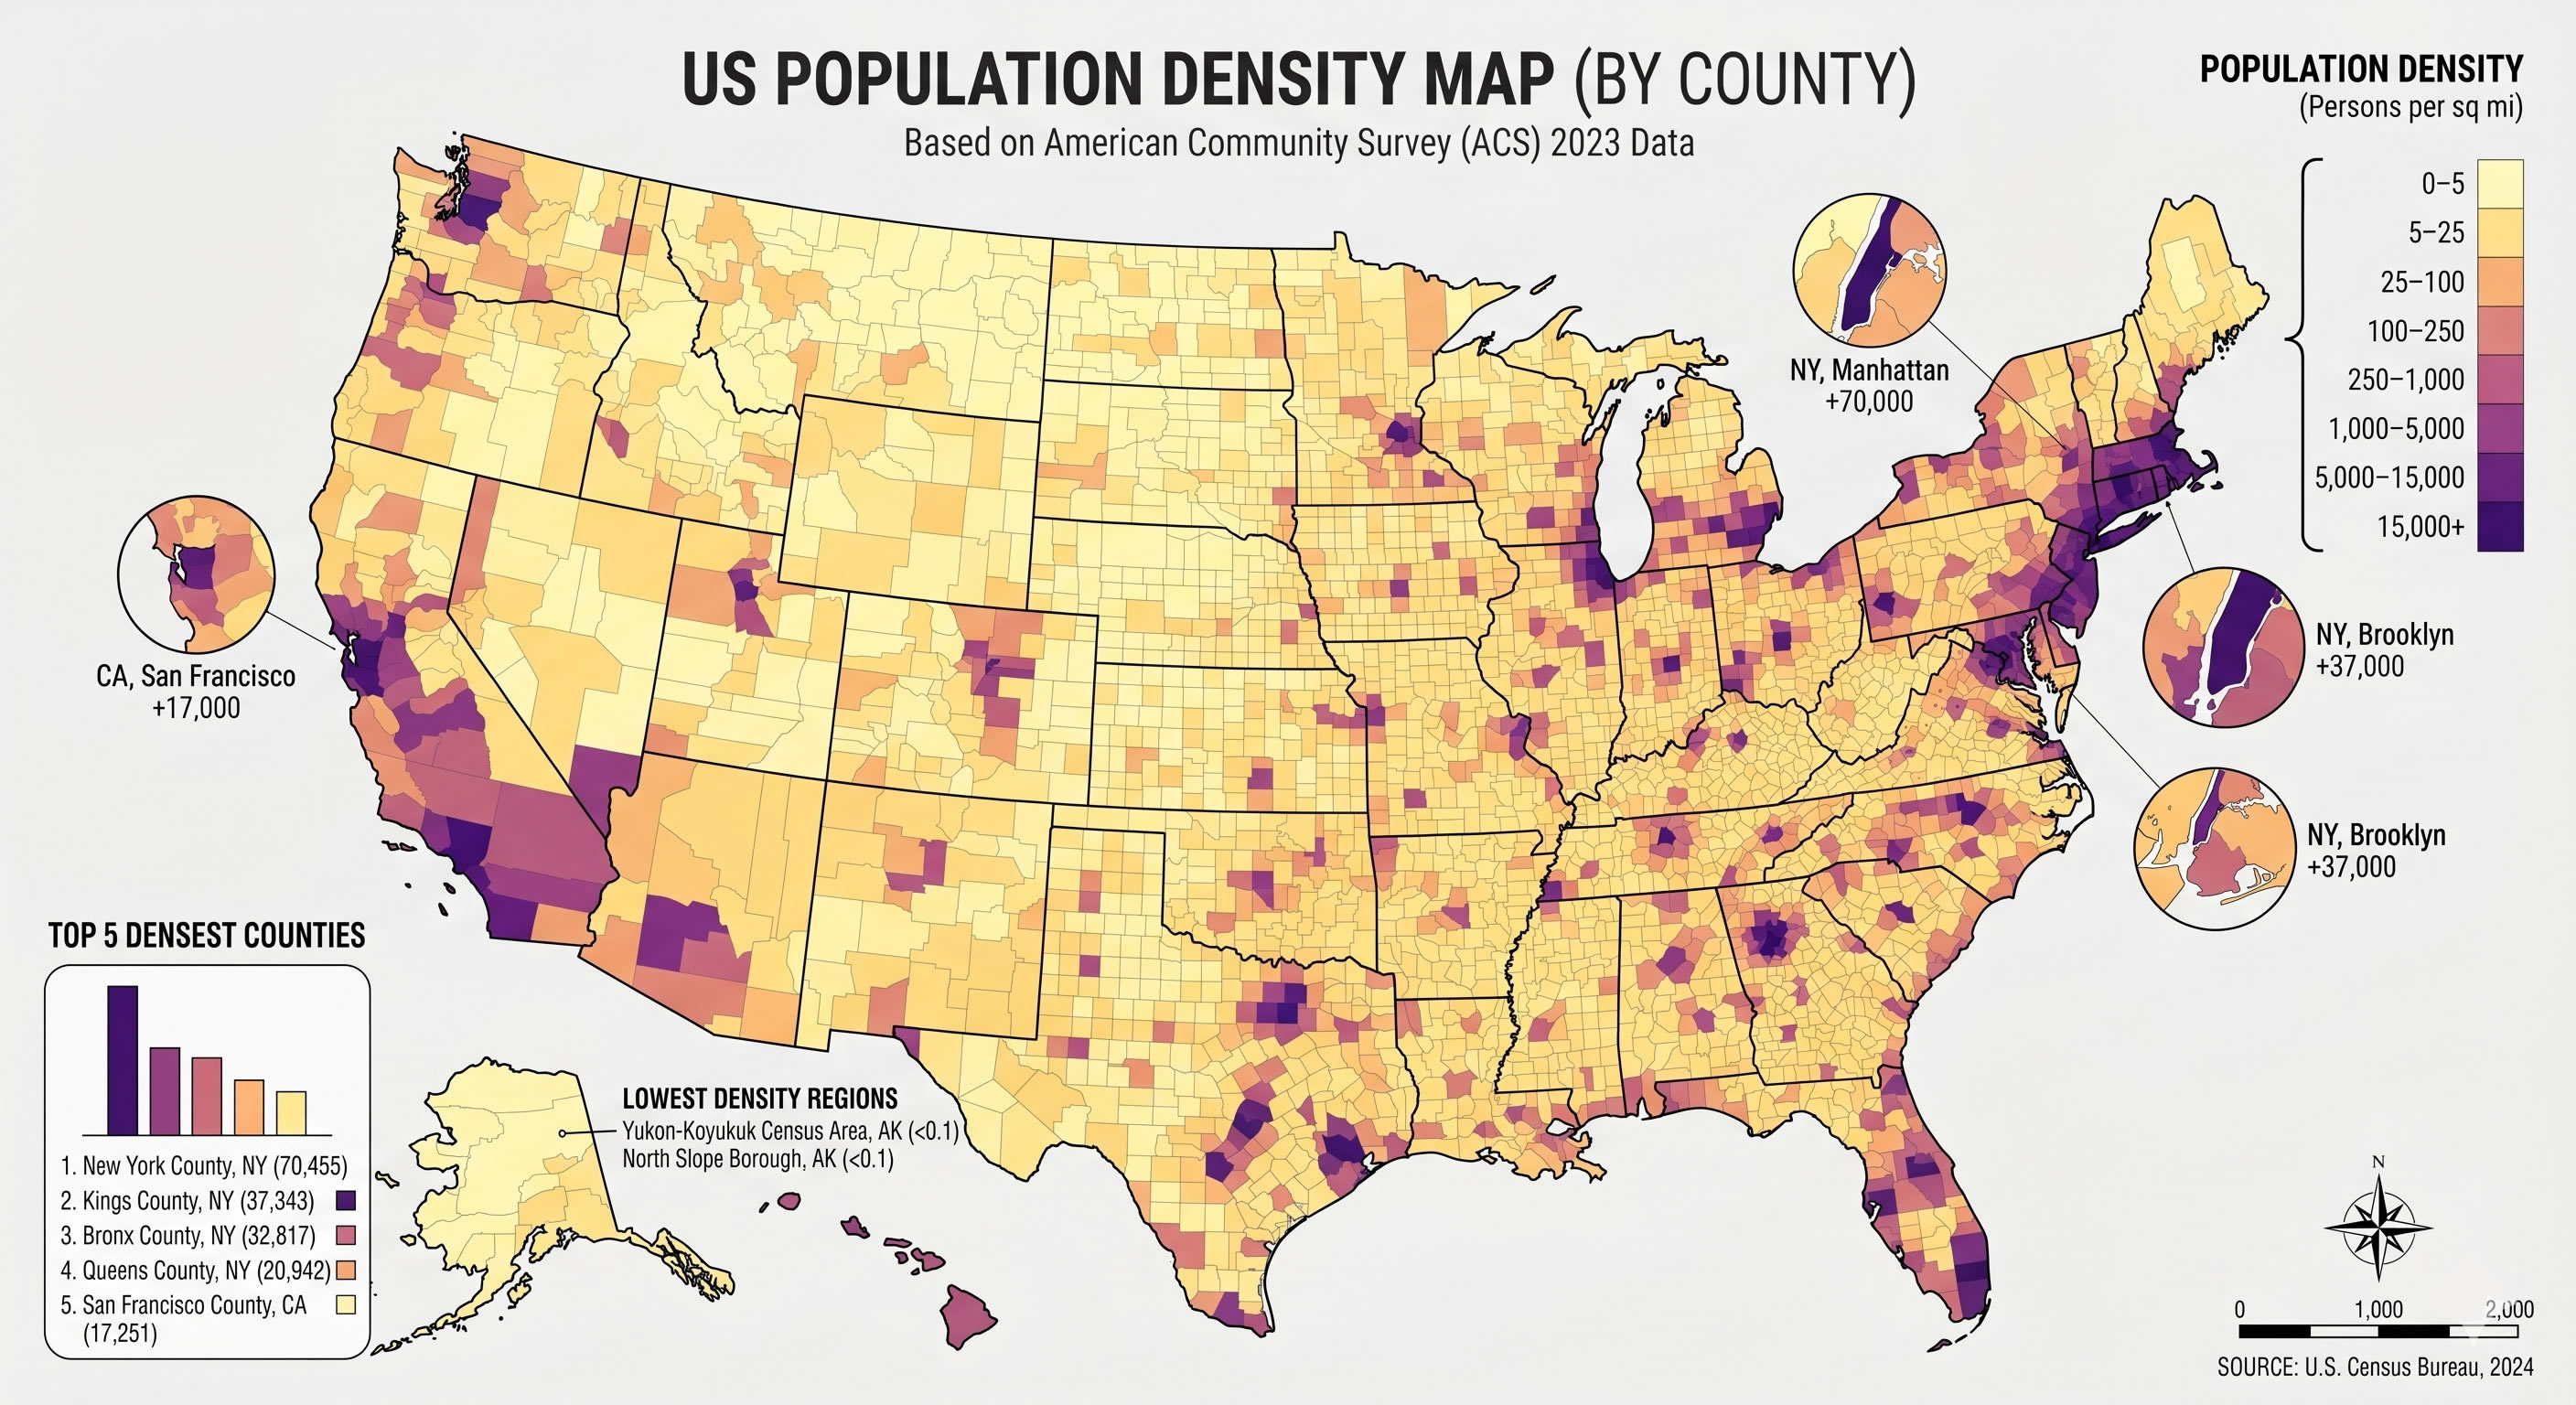
Population density maps illustrate that the densest states are New Jersey, Massachusetts, and Rhode Island, each exceeding 1,200 residents per square mile, while states like Wyoming, Montana, and Alaska have densities below 10. The heatmap overlays key infrastructure such as interstate highways, airports, and major rivers, revealing that most high-density corridors follow historical trade routes. Rural areas, especially in the Great Plains and the Upper Midwest, show clusters of small towns separated by wide expanses of agricultural land and natural reserves. These geographic patterns also correlate with socioeconomic indicators; higher density regions generally report higher median incomes, higher educational attainment, and greater access to health services. 
Implications
The uneven distribution of population density impacts several critical policy areas. In transportation, dense urban centers demand expanded public transit networks and congestion pricing, while rural states require investment in broadband connectivity and road maintenance to support dispersed communities. Politically, density influences the allocation of congressional seats, with the "one person, one vote" principle requiring adjustments to district boundaries to reflect shifts in population. Environmental considerations are also tied to density; densely populated areas experience higher energy consumption, increased waste production, and greater pressure on local ecosystems, whereas rural zones face challenges related to agricultural runoff and land use conservation.
US Population Density Map - Guide Of The World
US Population Density Map - Guide of the World
Map Of United States Population Density — Gridgrab

map of united states population density — Gridgrab
US Population Density Map - Guide Of The World
US Population Density Map - Guide of the World
United States Population Density Map

United States Population Density Map
United States Population Density Map

United States Population Density Map
US Population Density Map
US Population Density Map
United States Population Density Map - All For One

United States Population Density Map - All For One
Us Population Density Heat Map – XFPU

Us Population Density Heat Map – XFPU
Population Density Map Of USA 2025

Population Density Map of USA 2025
Us Population Density Map High Resolution - Assetelevision
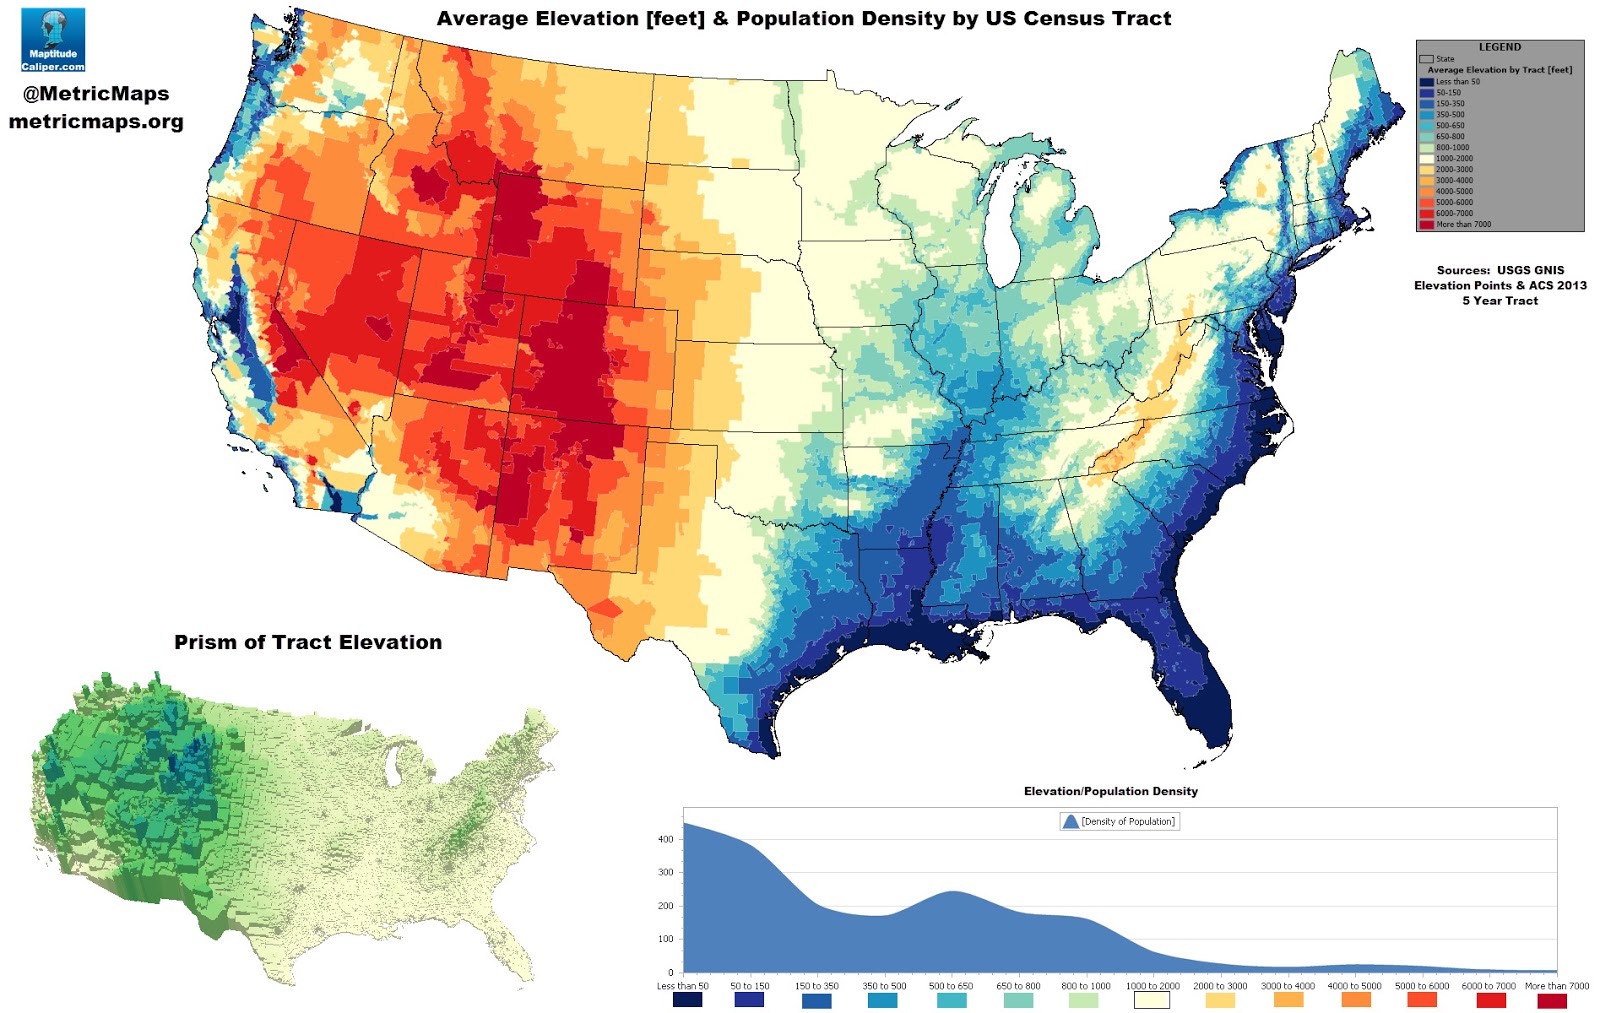
Us population density map high resolution - assetelevision
Us Population Density Heat Map - Statviet
Us population density heat map - statviet
US Population Density Map
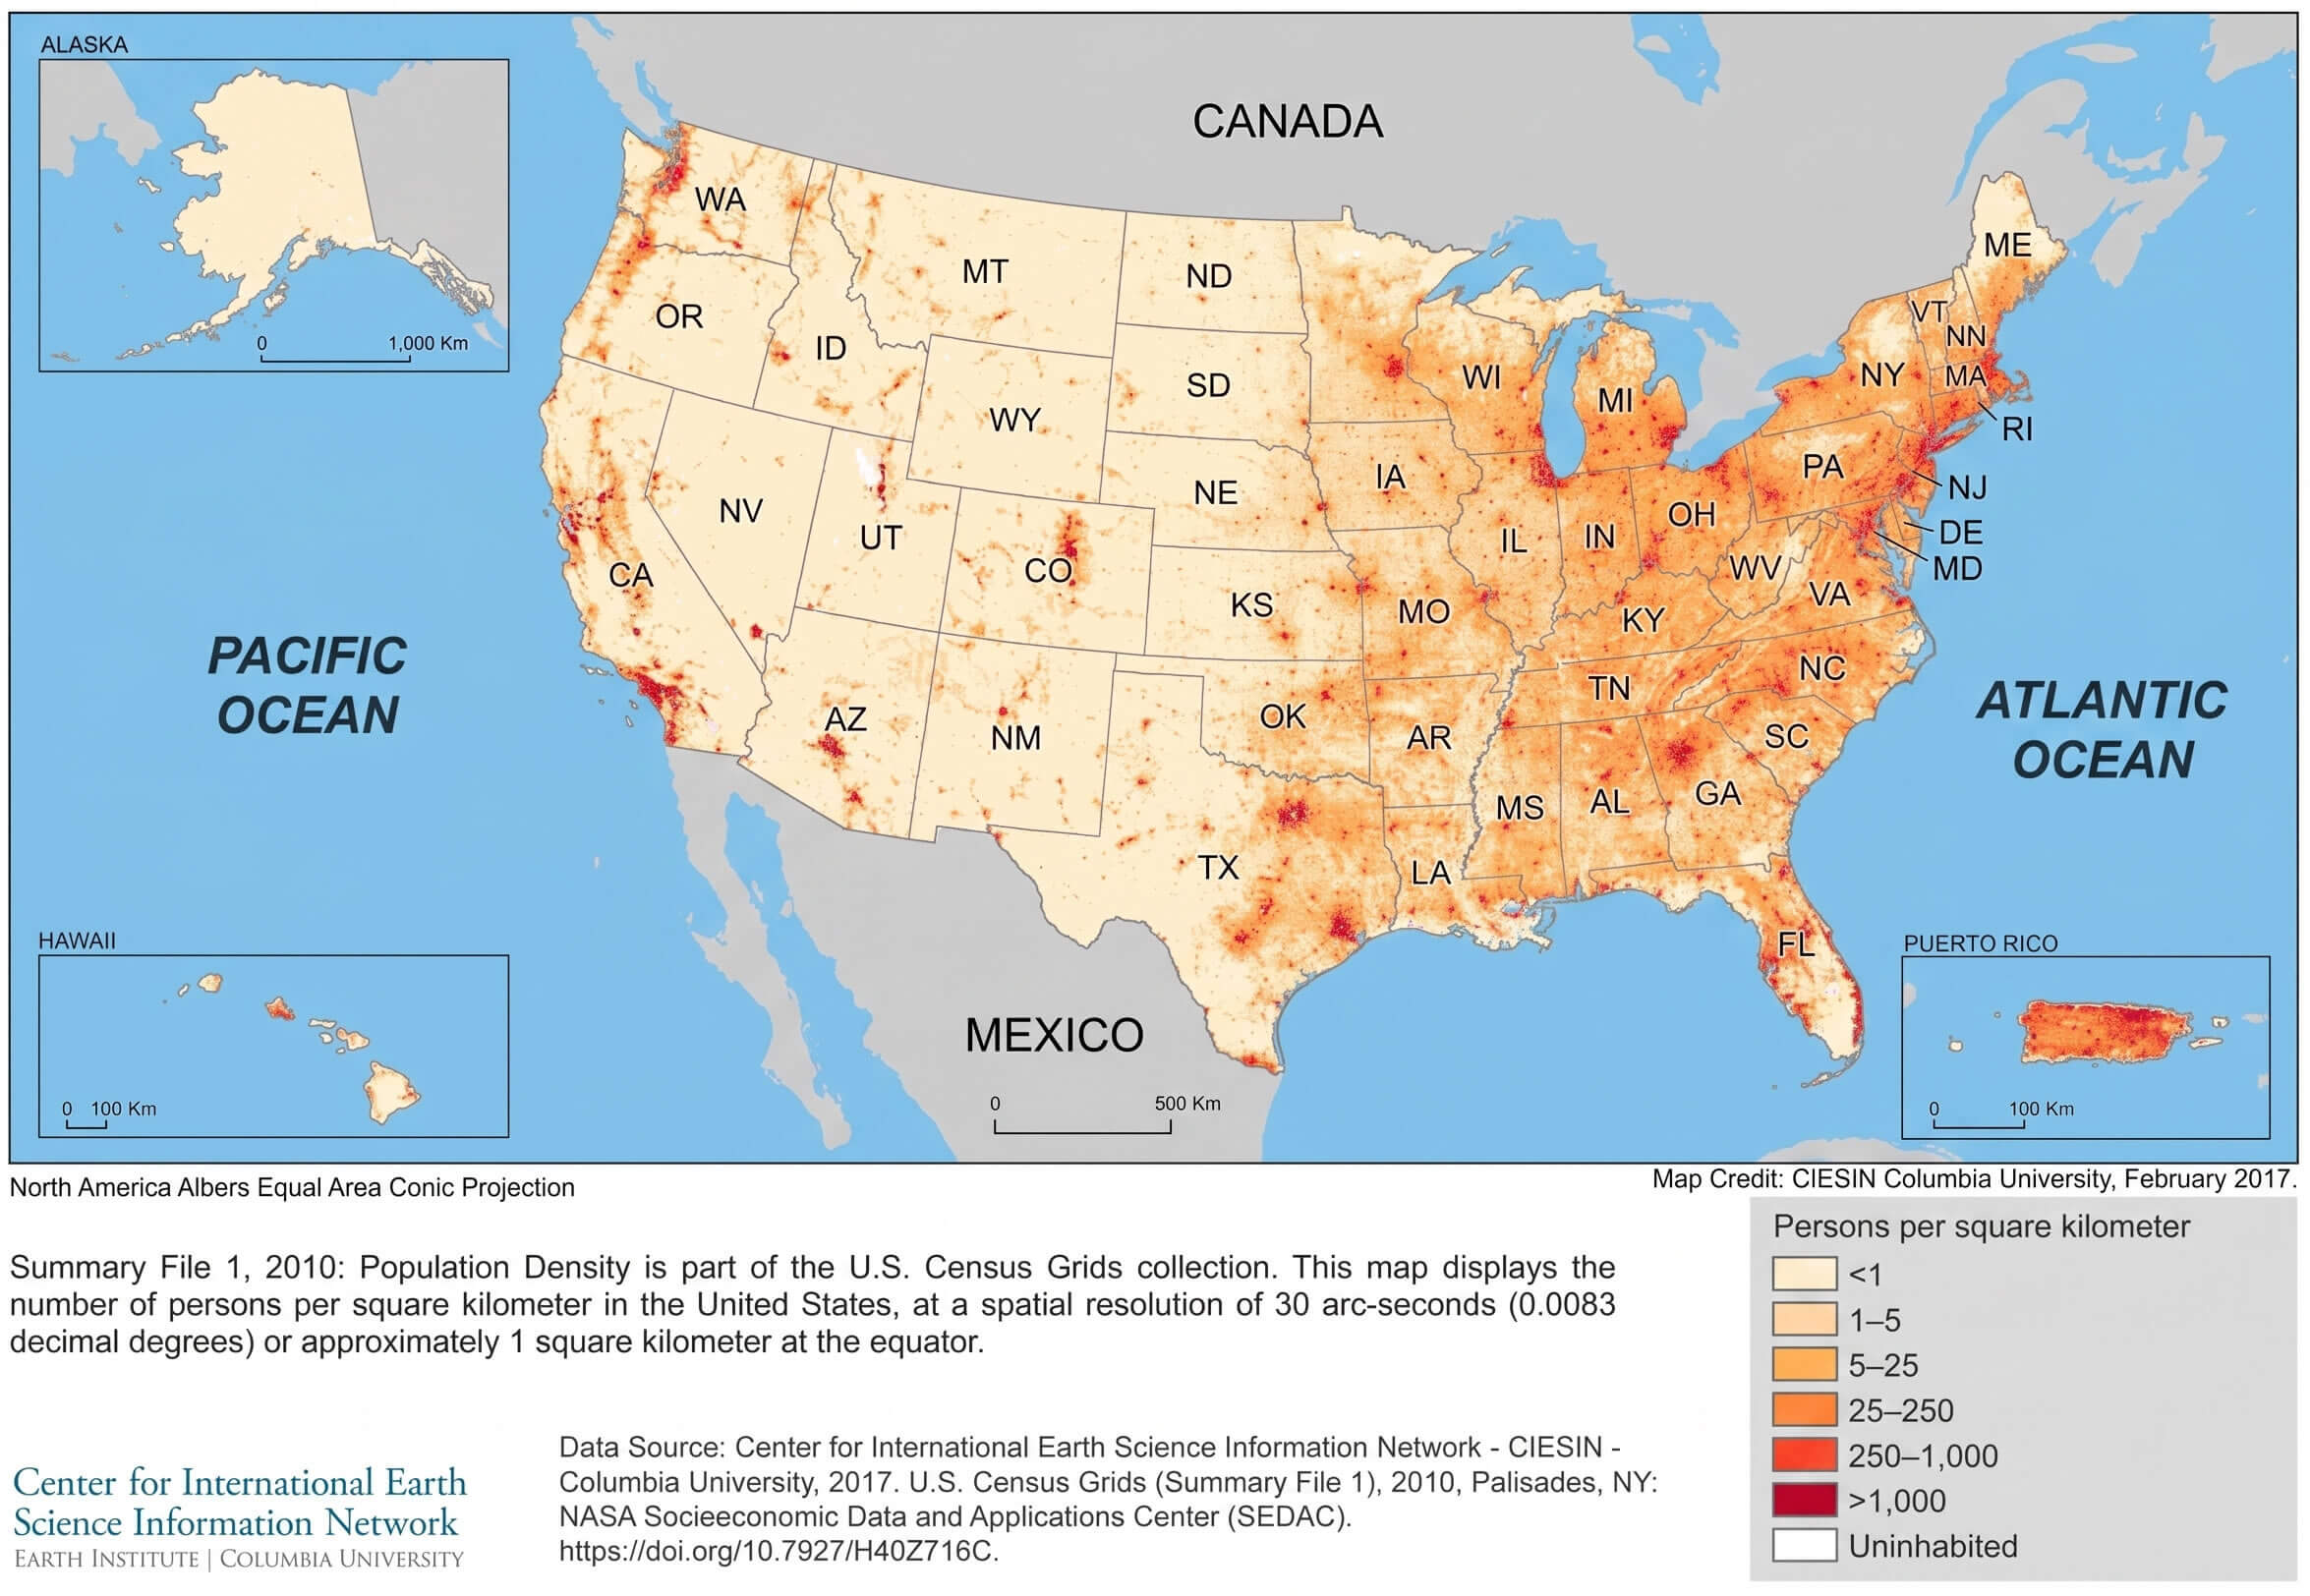
US Population Density Map
Population Of USA Map Density | Printable Map Of USA

Population Of USA Map Density | Printable Map Of USA
Us Population Density Map : Us Census Data Is Available Down To The
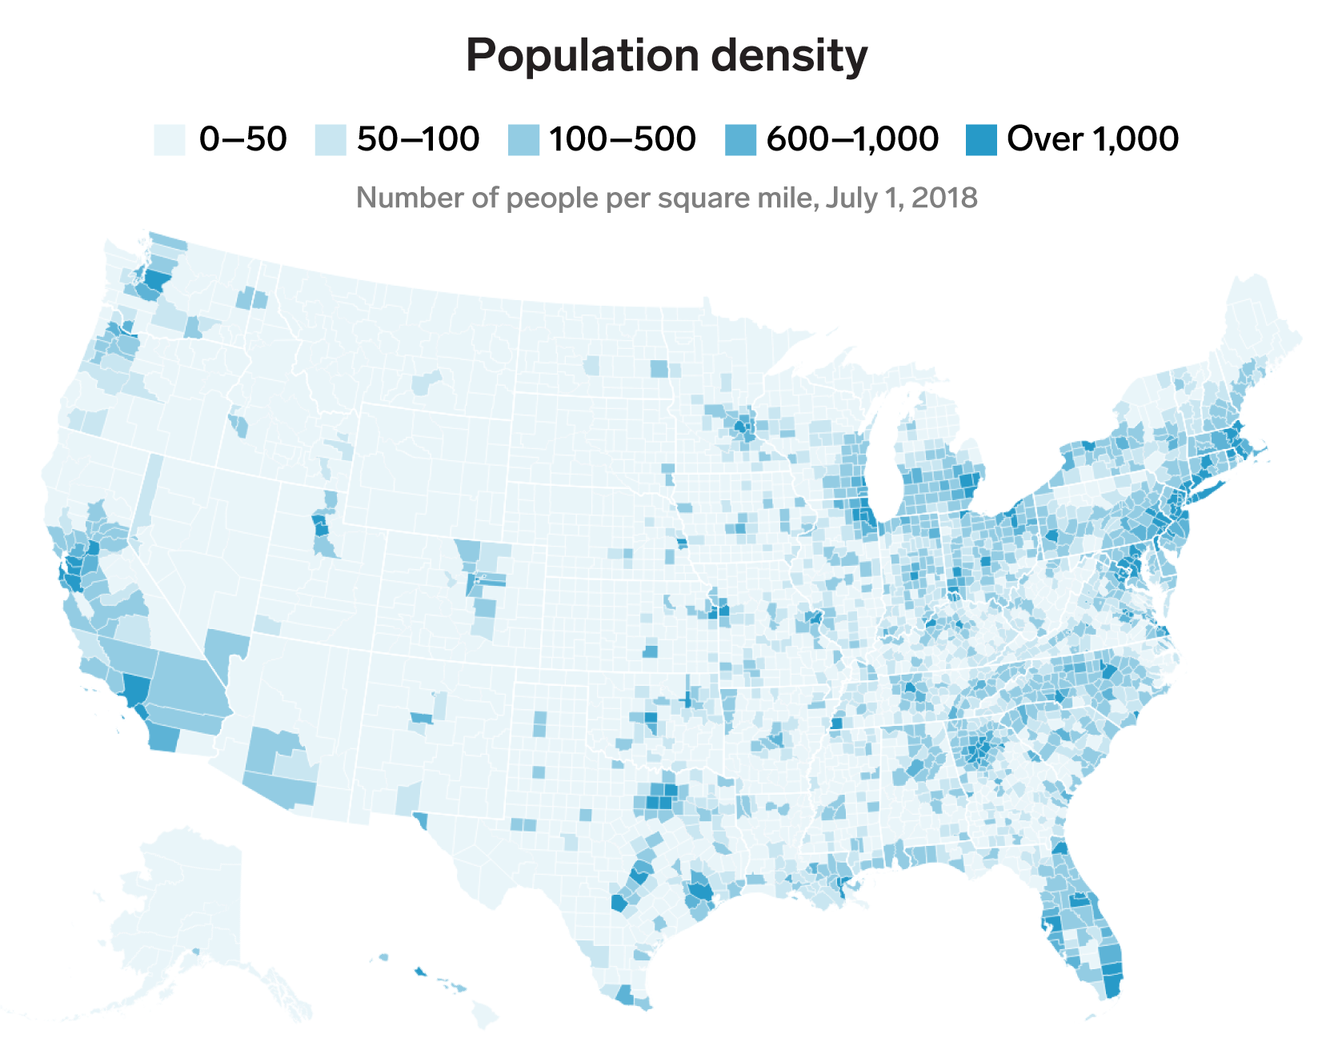
Us Population Density Map : Us census data is available down to the ...
US Population Density Map - Guide Of The World
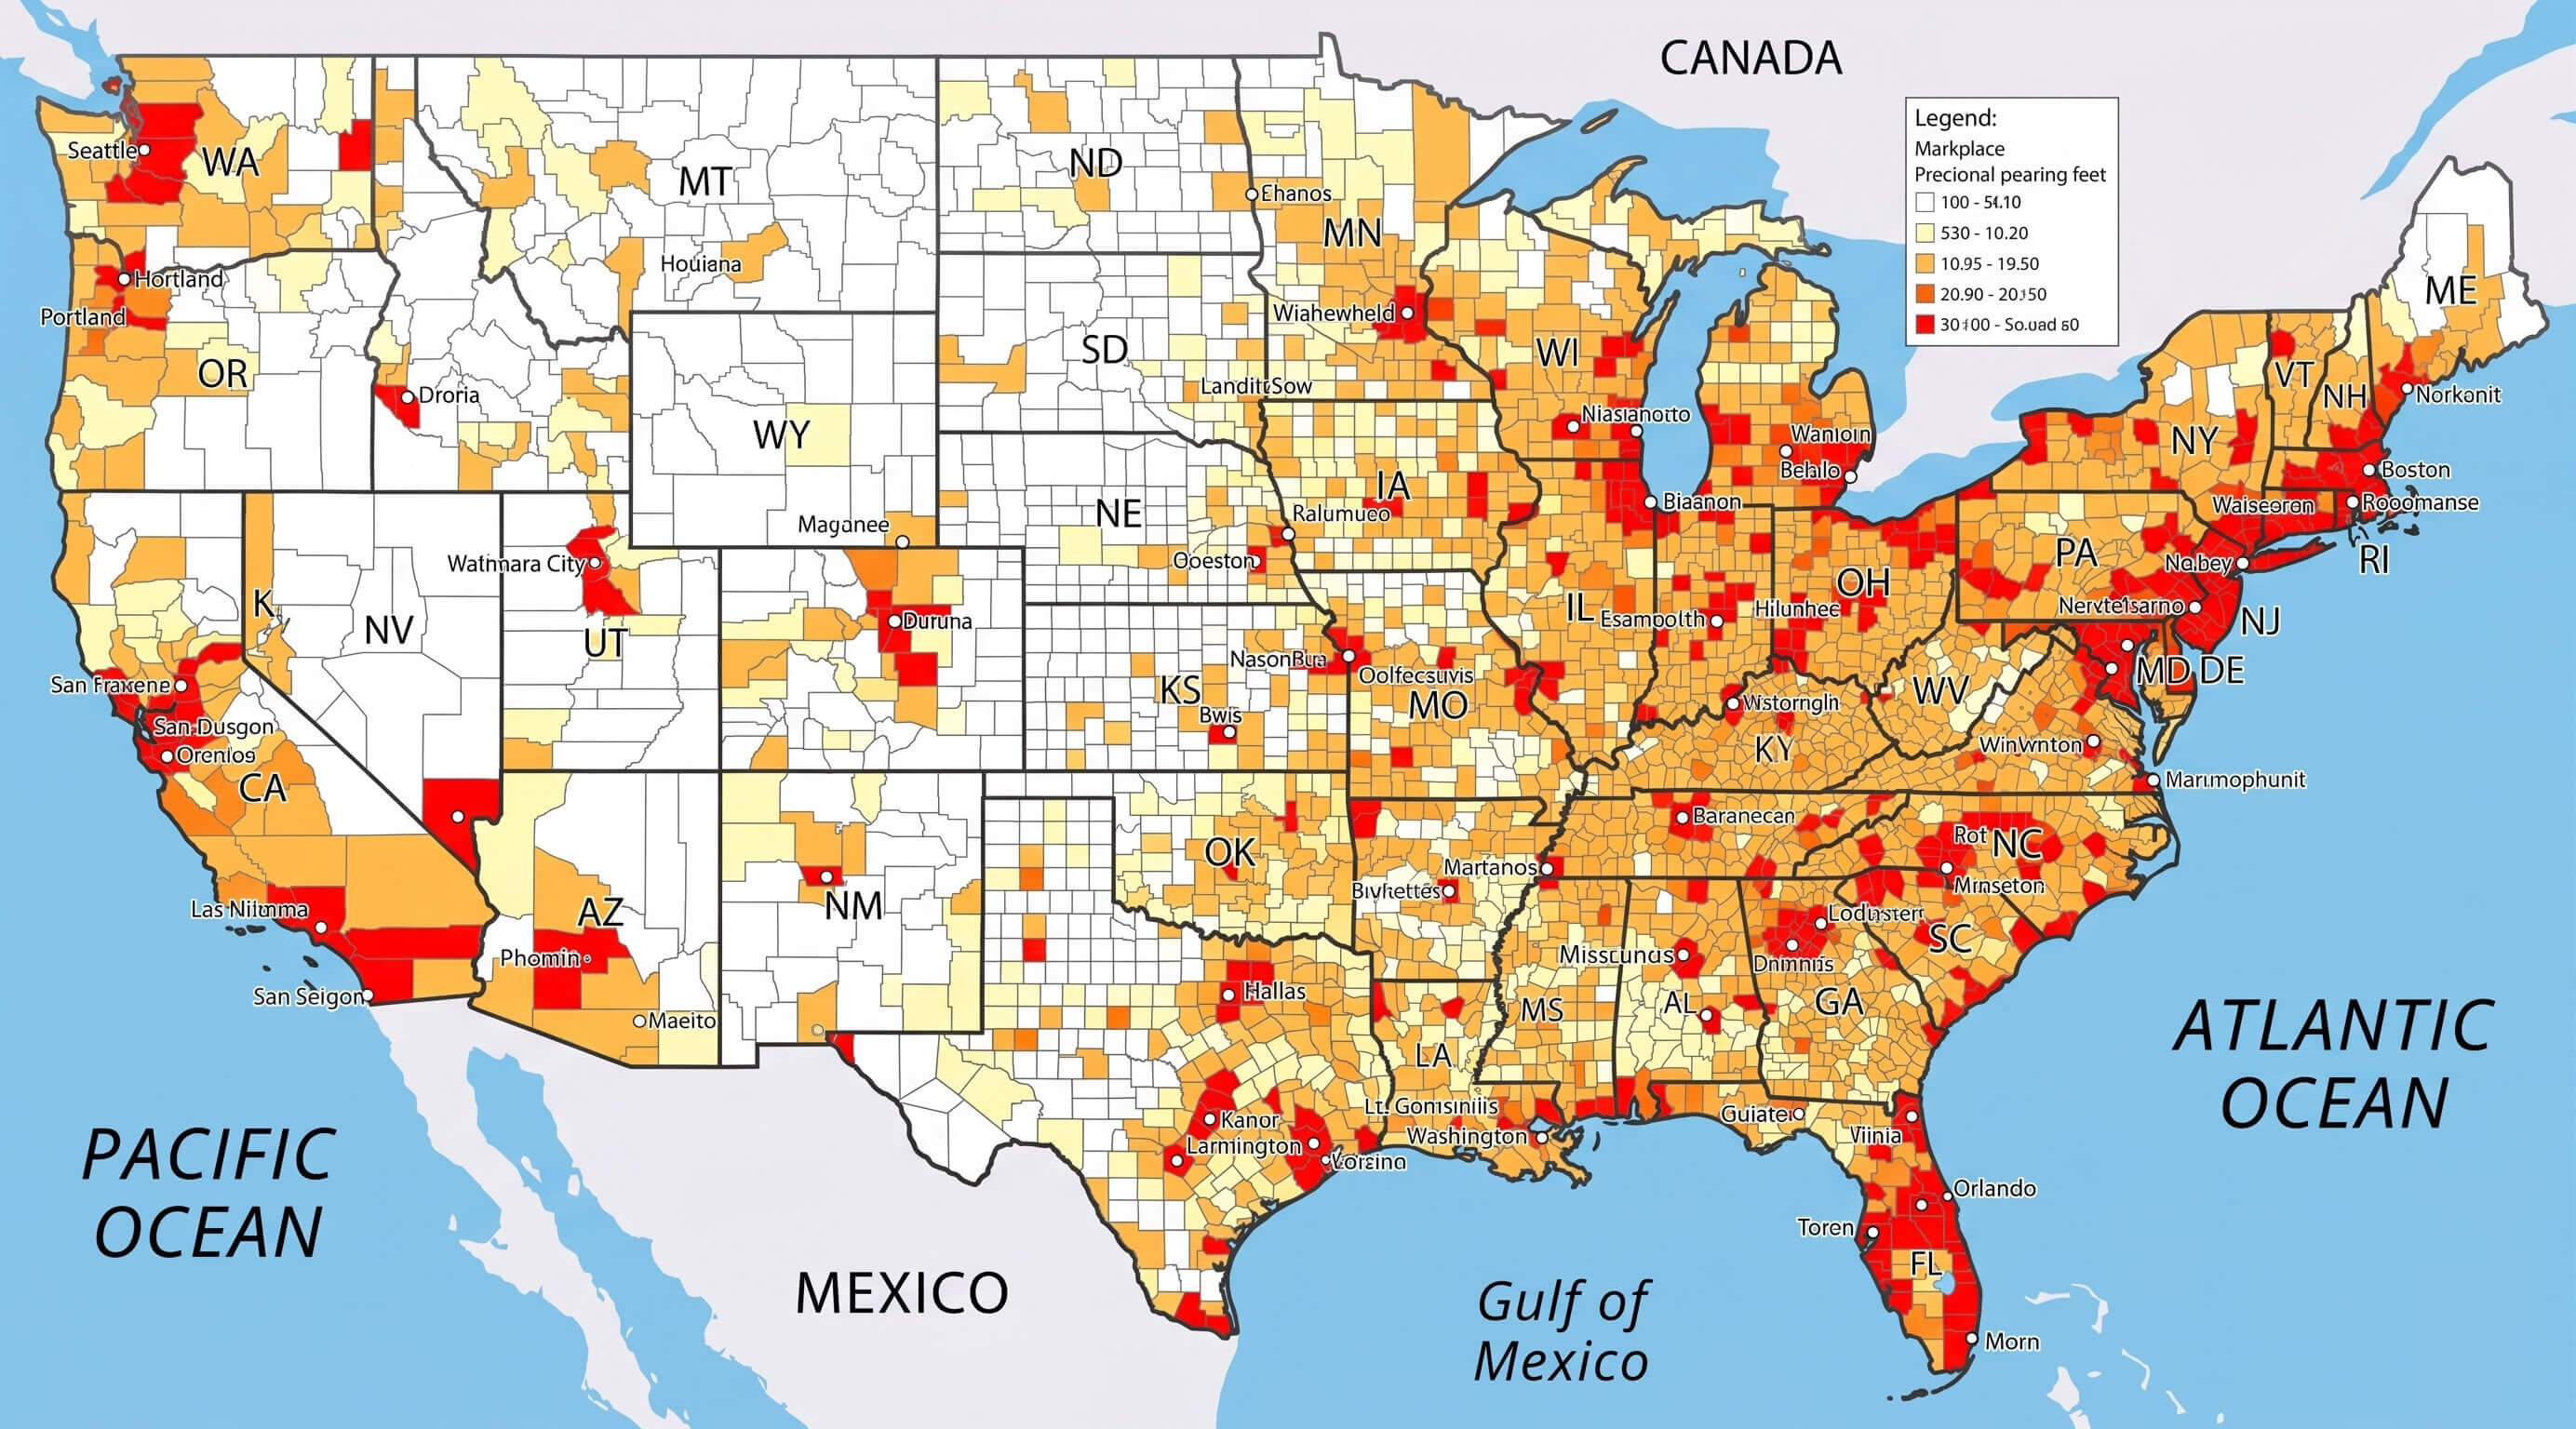
US Population Density Map - Guide of the World
U.S. Population Density Mapped - Vivid Maps

U.S. Population Density Mapped - Vivid Maps
Map Of The Us By Population Watch The U.S. Population Grow Over Time

Map Of The Us By Population Watch The U.S. Population Grow Over Time
United States Population Density Map

United States Population Density Map
Us Map Population Density Capturing The Size And Density Of New York

Us Map Population Density Capturing The Size And Density Of New York
U.S. County Population Density Map

U.S. County Population Density Map
State Population Density Usa – Population Density By State 2025 – CREM

State Population Density Usa – Population Density By State 2025 – CREM
U.S. Population Density Map | Map, United States Map, Human Geography

U.S. Population Density Map | Map, United states map, Human geography
Us Population Density Map 2020 - Pdffeet

Us population density map 2020 - pdffeet
Us Population Density Map 2016 - Mettolf

Us population density map 2016 - mettolf
Us Population Density Km2 : Population Density United States Of America
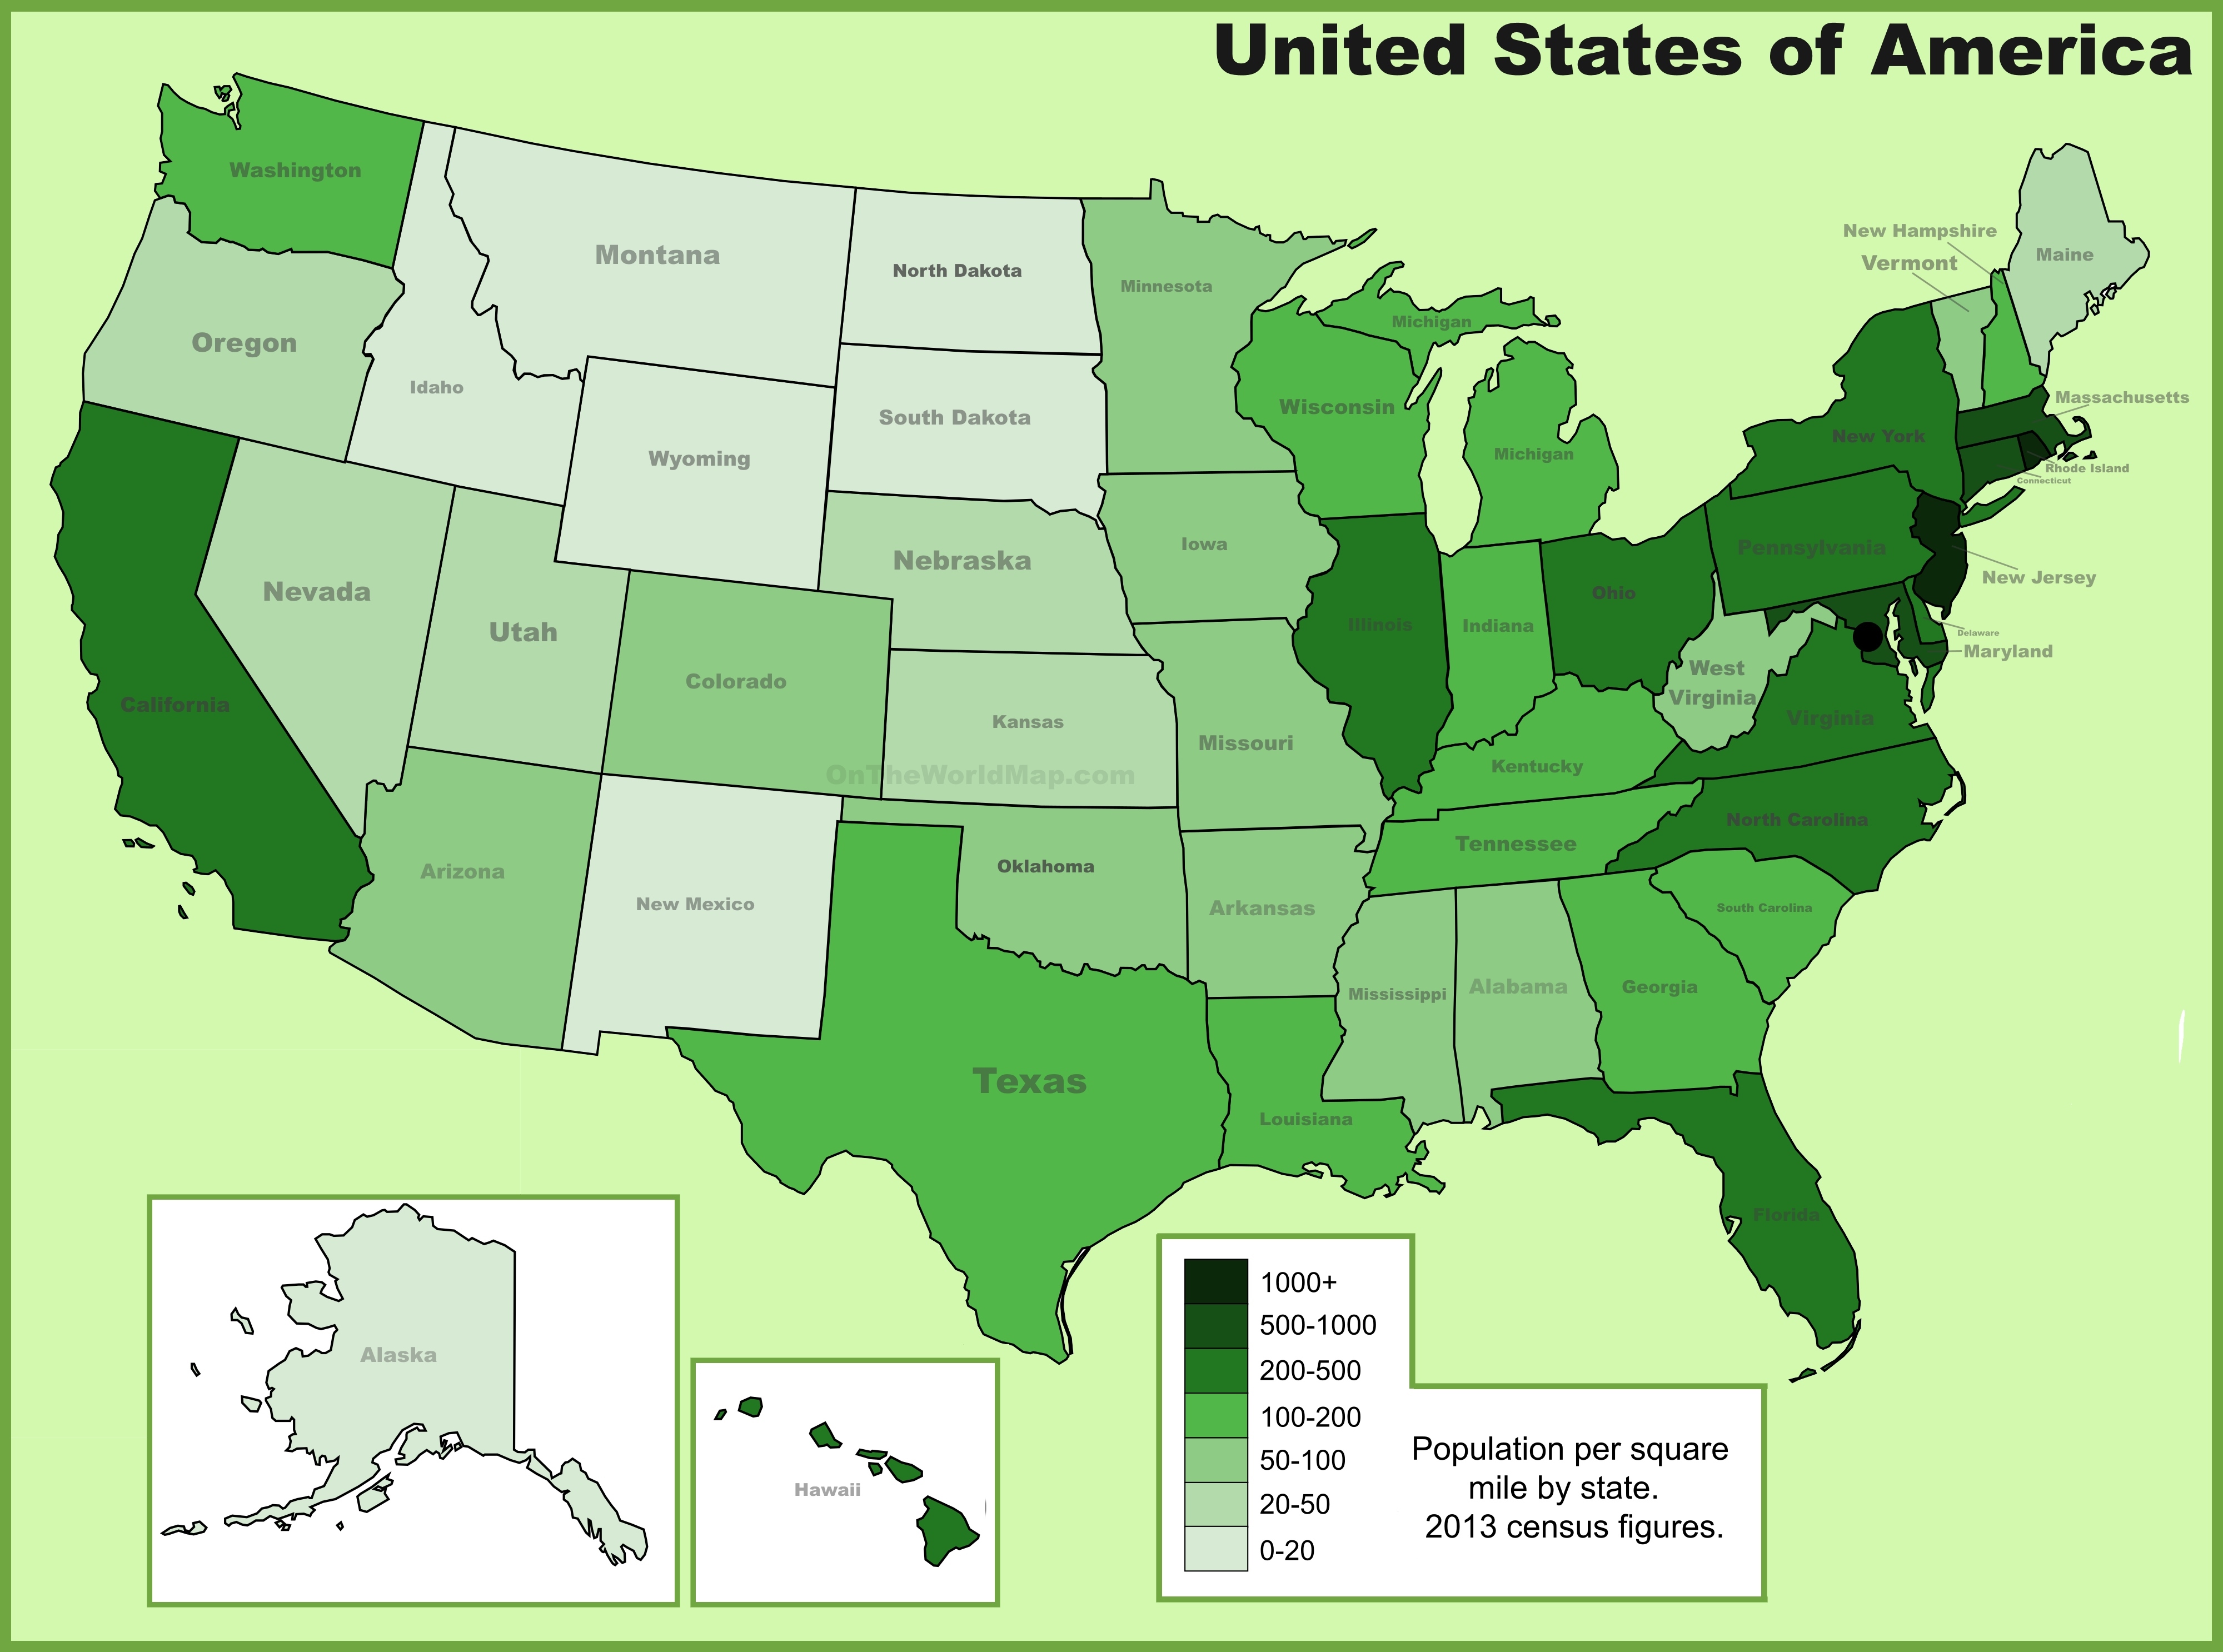
Us Population Density Km2 : Population Density United States Of America ...
US Population Density Map - Guide Of The World
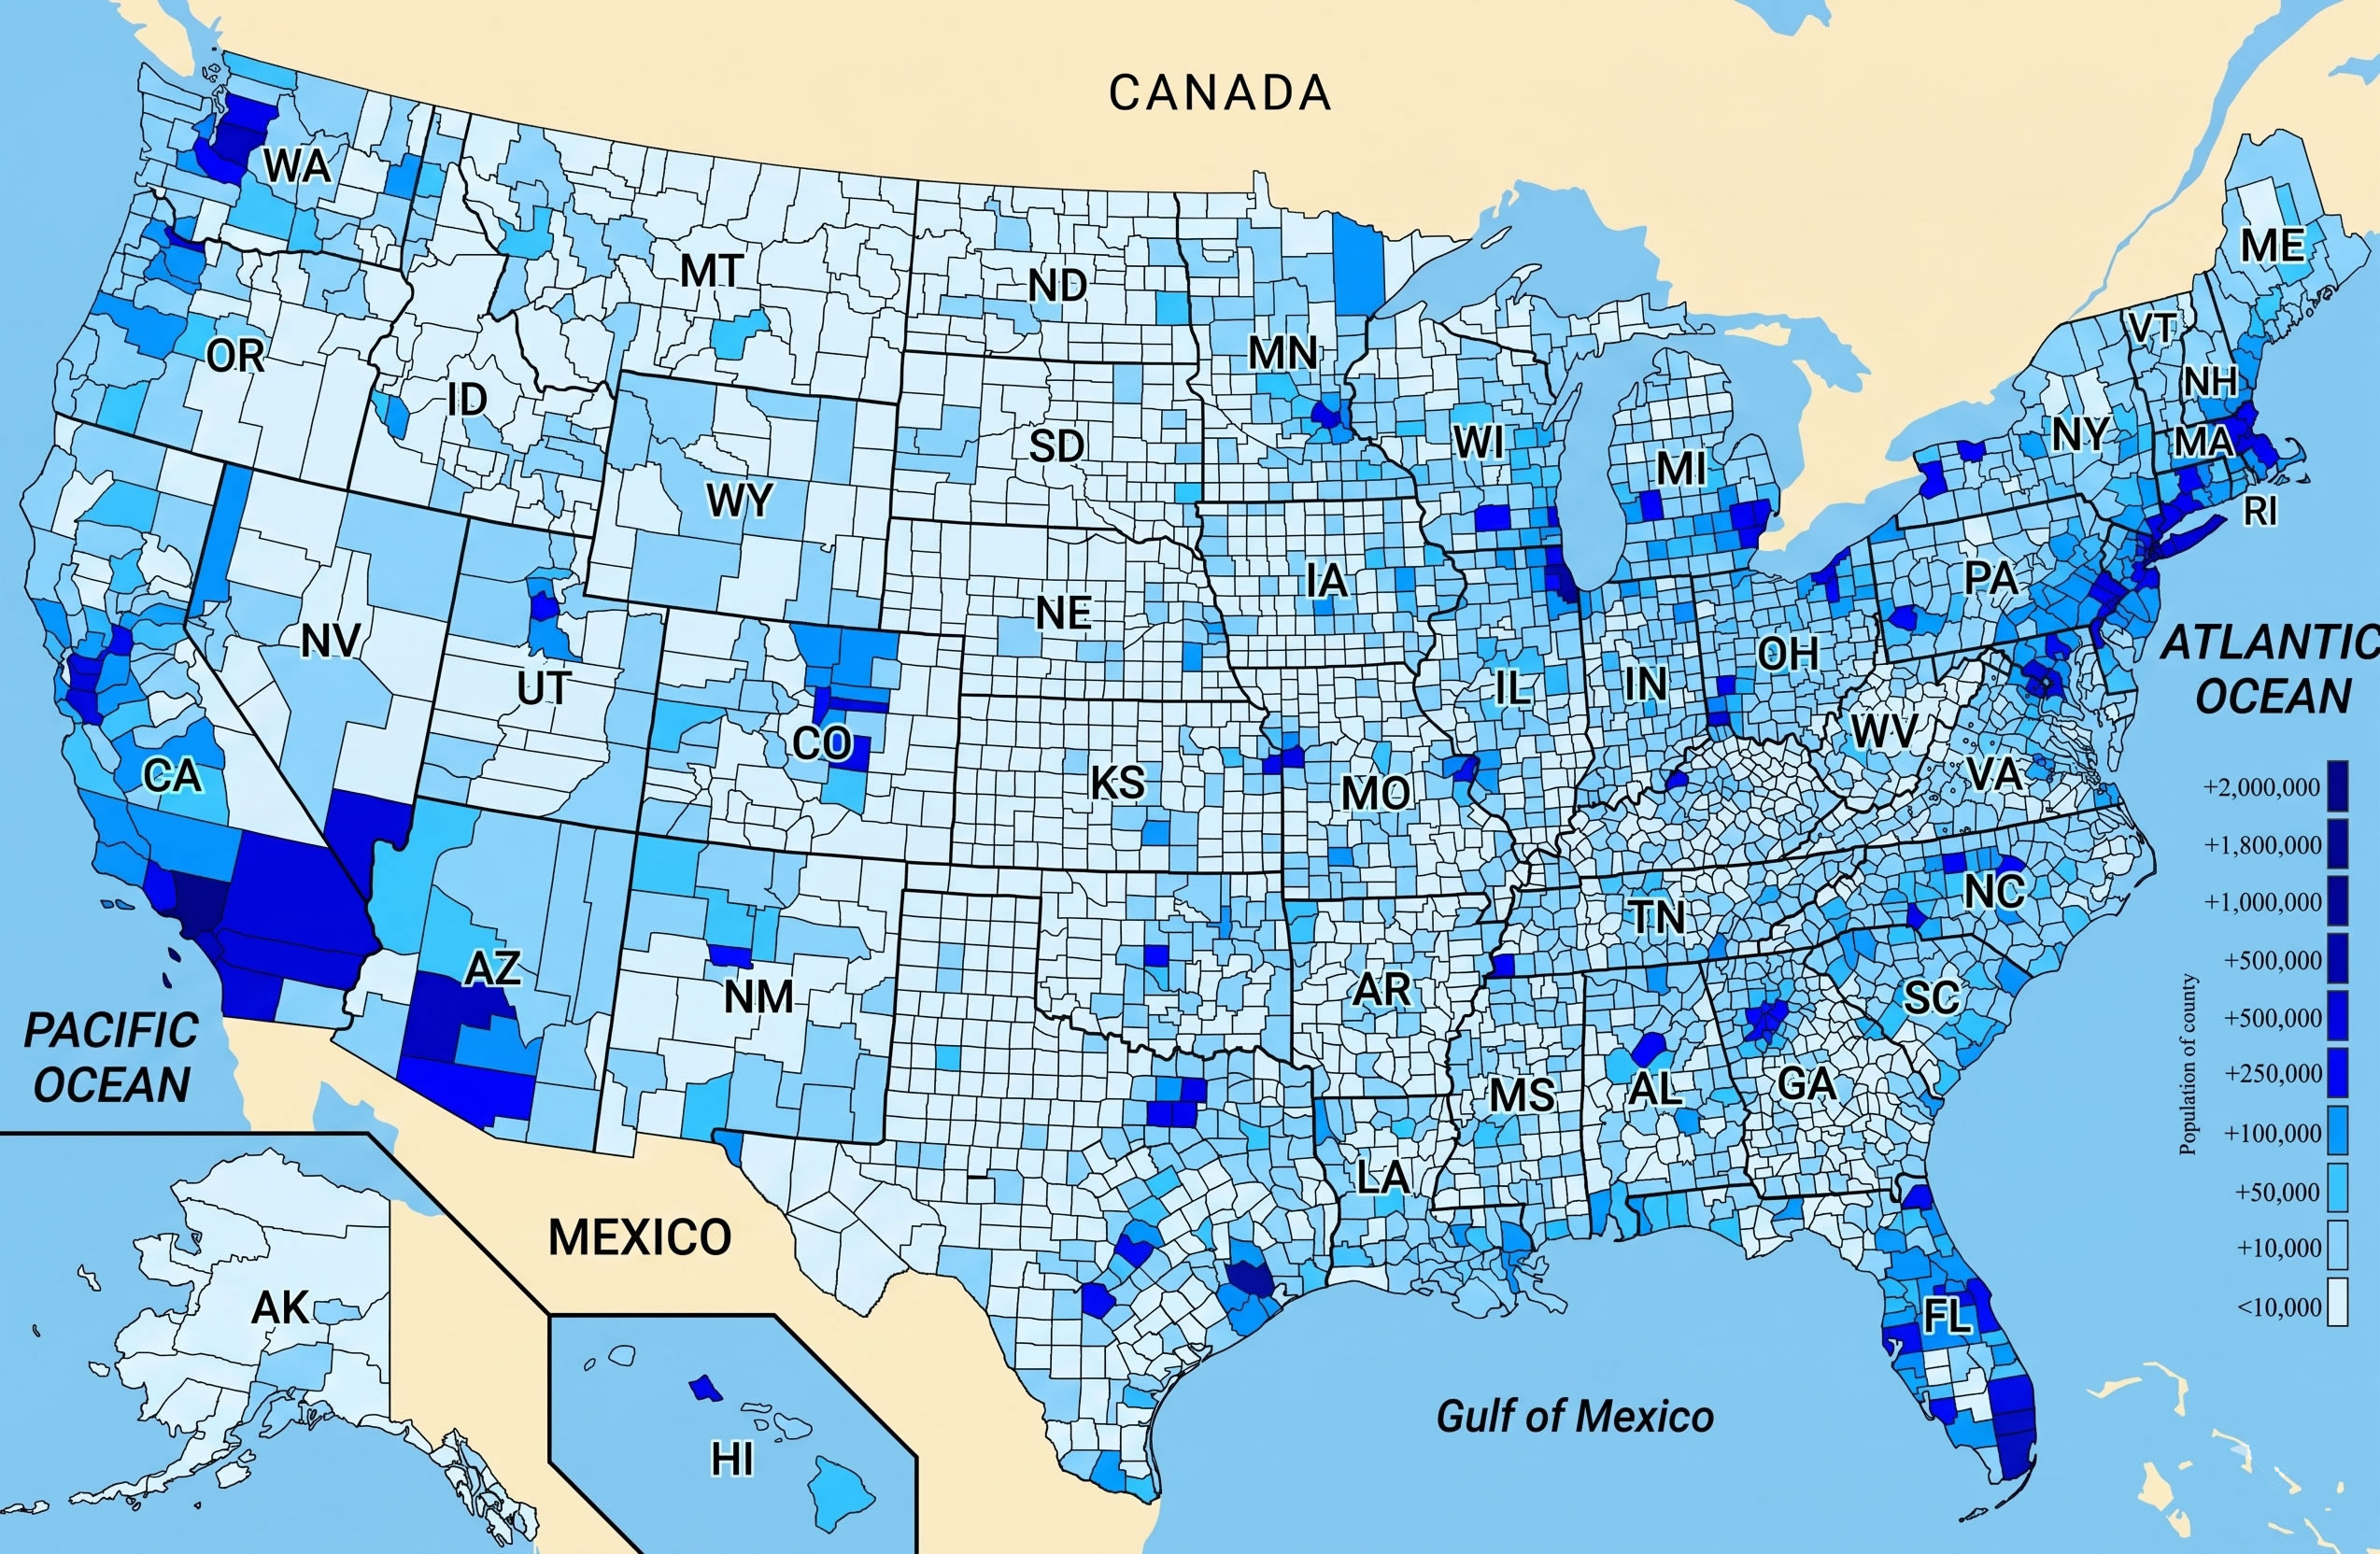
US Population Density Map - Guide of the World
United States Population Density Map
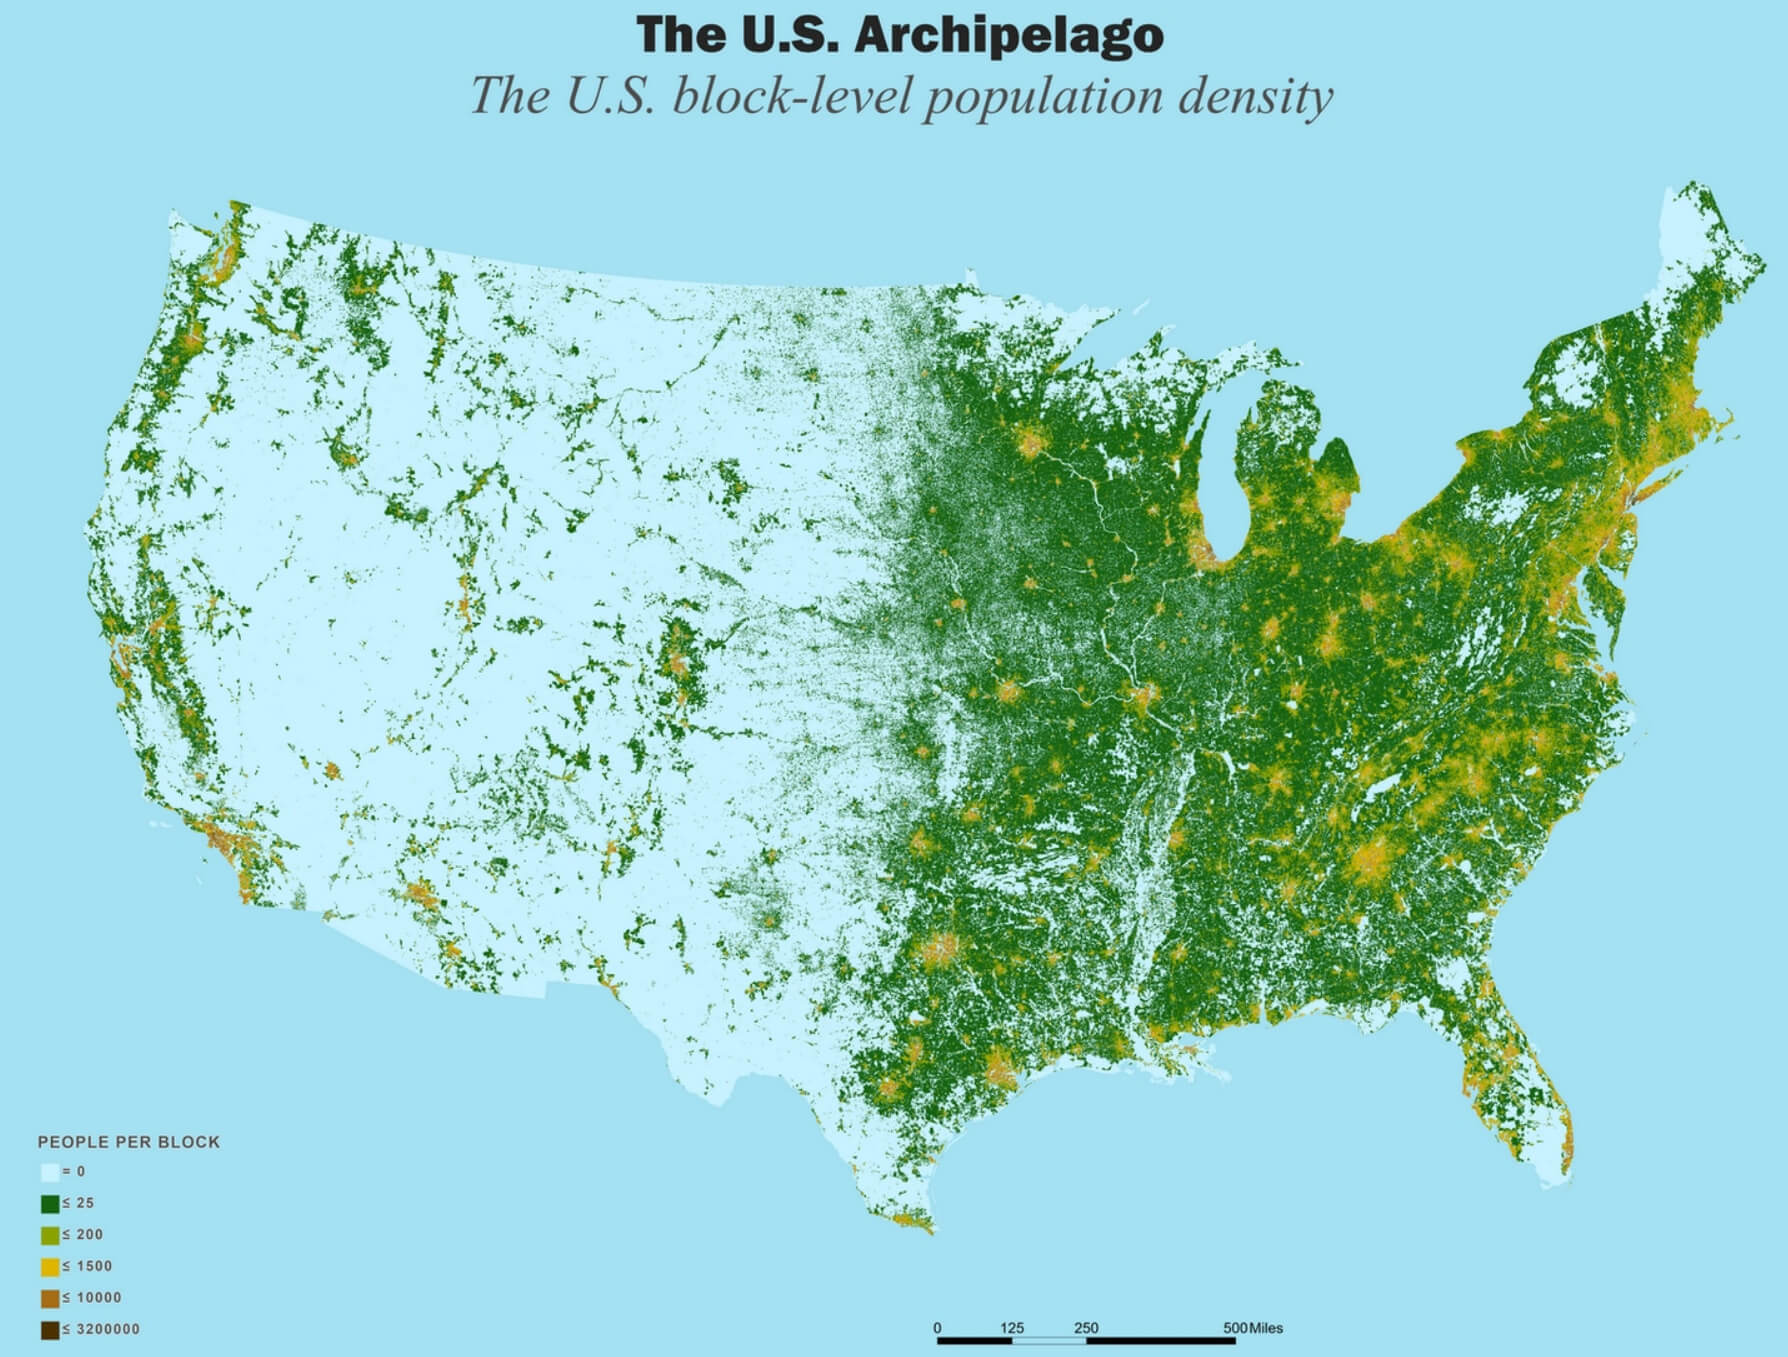
United States Population Density Map
US Population Density Map - Guide Of The World
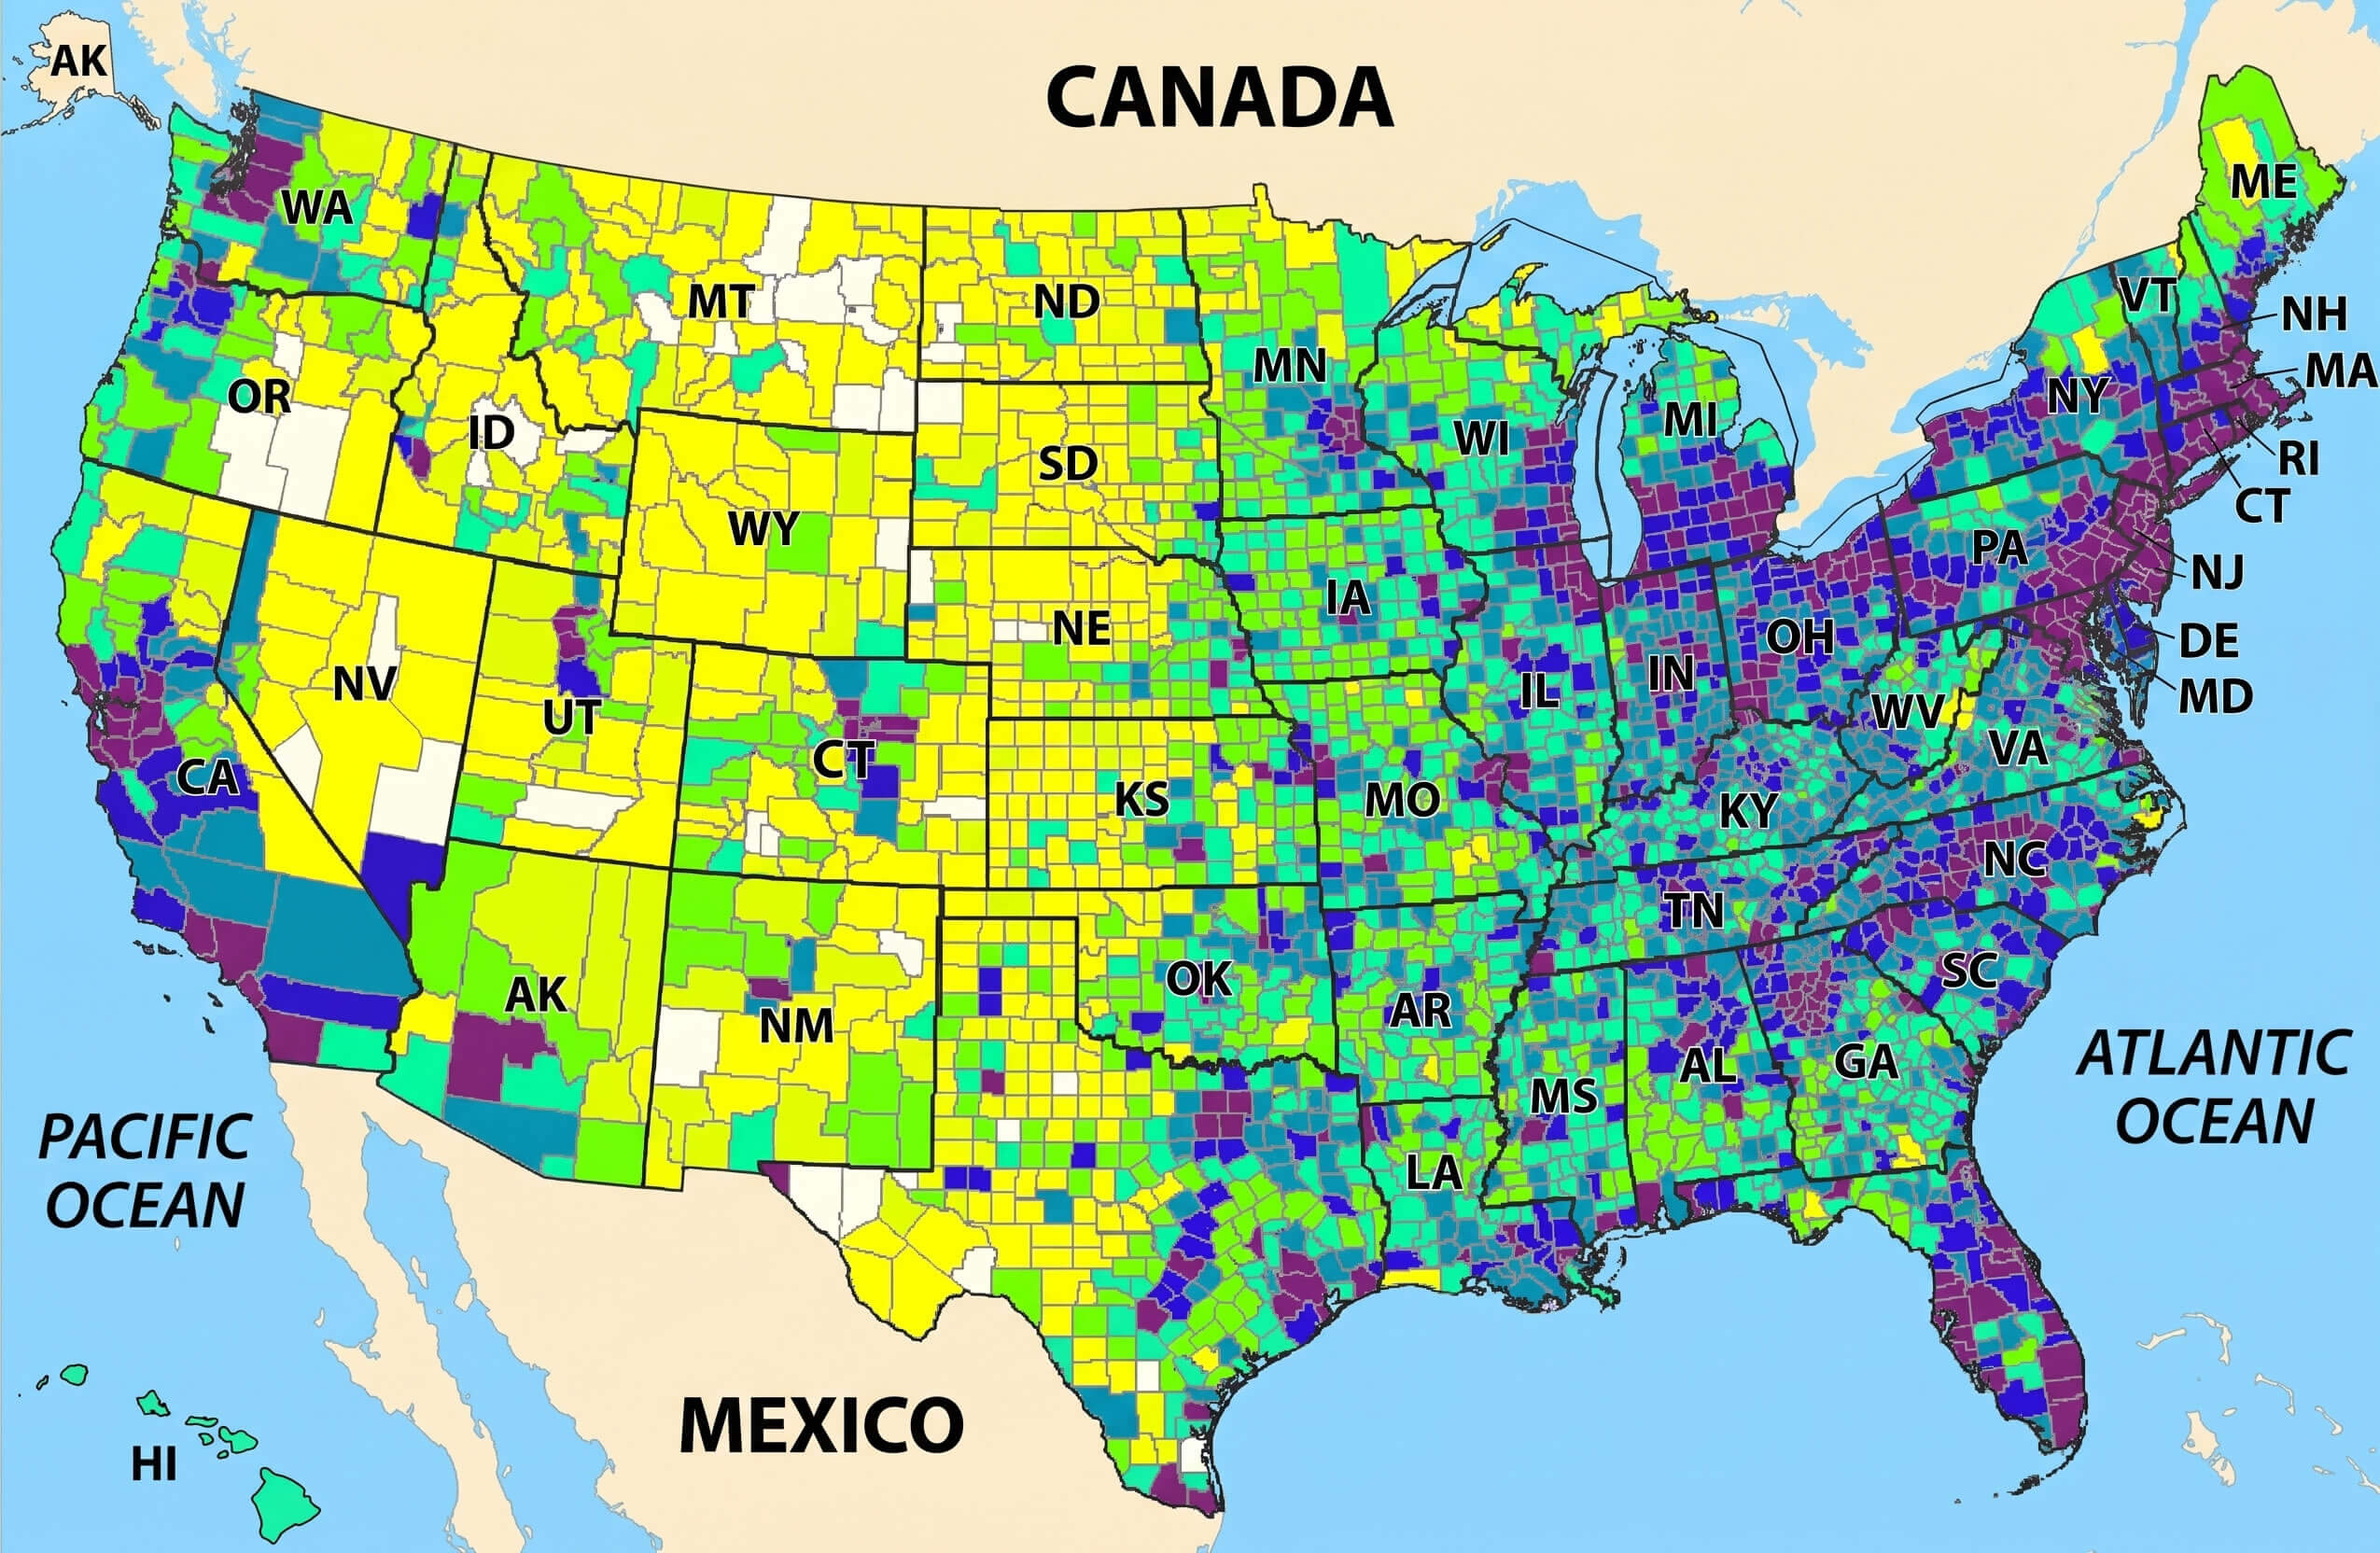
US Population Density Map - Guide of the World
