U.S. Foreign-Born Population Map Highlights Growth and Diversity Trends 1850-2024
The United States has seen a steady rise in the share of foreign-born residents over the past century and a half, reaching 13.5% of the total population in 2023. This growth reflects historic immigration waves, shifting policies, and changing economic needs. A detailed map of the foreign-born population reveals geographic hotspots, demographic nuances, and potential implications for future policy and planning.
Historical Evolution of the Foreign-Born Share
From 1850 to 2024, the foreign-born proportion of the U.S. population has fluctuated markedly. Early 19th-century influxes of Irish, German, and Scandinavian settlers set the baseline. The 1924 Immigration Act imposed quotas, sharply reducing new arrivals. The 1965 Immigration and Nationality Act removed national origin quotas, sparking a diverse wave of immigrants from Asia, Latin America, and Africa. More recent decades have seen a sustained upward trend, with the foreign-born share growing from under 2% in 1970 to 13.5% today. This trajectory underscores the U.S.'s role as a global destination and the evolving nature of its demographic makeup.
Geographic Distribution and State-Level Variations
Foreign-born residents are not evenly distributed across the country. California leads with the highest concentration, accounting for over 25% of the nation's foreign-born population. New York and Texas also have substantial shares, while states like Vermont and North Dakota have comparatively low figures. Urban centers such as New York City, Los Angeles, and Chicago attract immigrants due to job opportunities, established ethnic communities, and robust support services. Conversely, rural areas often report slower growth in foreign-born numbers, reflecting limited employment prospects and fewer assimilation resources.
Demographic Profile of the Foreign-Born Population
Age distribution among foreign-born residents skews younger, with a median age of 32 years compared to 38 for the native-born population. Women comprise slightly more than 48% of the foreign-born cohort, reflecting global migration patterns. Countries of origin have diversified: 35% arrive from Mexico, 20% from China, 10% from India, 8% from the Philippines, and 7% from El Salvador. Others originate from Vietnam, Korea, the Dominican Republic, and various sub-Saharan African nations. This mix illustrates the multi-ethnic tapestry that defines contemporary U.S. immigration.

Socioeconomic Impact and Policy Implications
Foreign-born workers contribute significantly to the U.S. economy, filling roles across technology, manufacturing, agriculture, and service sectors. They account for nearly 40% of entrepreneurs who start new businesses, generating jobs and fostering innovation. On the labor market front, immigrants often occupy high-skill and low-skill positions, complementing native-born workers and aiding productivity growth. Policy debates focus on balancing border security, workforce needs, and humanitarian responsibilities. Recent legislative proposals aim to streamline visa processes, expand pathways to citizenship, and address labor market inequities that disproportionately affect immigrant communities.
Future Outlook and Emerging Trends
Projection models anticipate a continued rise in foreign-born share, potentially reaching 15% by 2035 if current trends persist. Shifts in global migration drivers—such as climate change, political instability, and economic inequality—may alter source-country profiles. Technology-enabled remote work could decentralize immigrant settlement patterns, encouraging newcomers to locate beyond traditional metropolitan hubs. Policymakers must anticipate these dynamics to craft responsive immigration frameworks, ensure inclusive integration, and harness the demographic dividend that a diverse workforce can offer.
Foreign-born Population In The US By Continent Of Birth

Foreign-born population in the US by continent of birth
Demographics – US Census Maps - ECPM Langues

Demographics – US Census Maps - ECPM Langues
Demographics – US Census Maps - ECPM Langues

Demographics – US Census Maps - ECPM Langues
A Map Of US Census Data Shows The Percentage Of The Population That’s

A map of US Census data shows the percentage of the population that’s ...
Foreign-Born Population From Africa, 2000 (2005) | Gilder Lehrman

Foreign-Born Population from Africa, 2000 (2005) | Gilder Lehrman ...
The Foreign-Born Population In The United States: 2022 - Information

The Foreign-Born Population in the United States: 2022 - information ...
Foreign-Born Population In USA [4556x2028] : R/MapPorn

Foreign-Born Population in USA [4556x2028] : r/MapPorn
Foreign Born Population Us _ Foreign Born Population – PUNMCW

Foreign Born Population Us _ Foreign Born Population – PUNMCW
New Report On The Nation’s Foreign-Born Population

New Report on the Nation’s Foreign-Born Population
🇺🇸 US Foreign-Born Population Since 2002: 2002 🇺🇸 Population: 33.0

🇺🇸 US Foreign-Born Population Since 2002: 2002 🇺🇸 Population: 33.0 ...
US States By Foreign Born Population. - Maps On The Web

US states by foreign born population. - Maps on the Web
Largest Foreign-born Population By State.... - Maps On The Web

Largest foreign-born population by state.... - Maps on the Web
📈 Foreign-Born Population Across U.S. States (2022) - Voronoi

📈 Foreign-Born Population Across U.S. States (2022) - Voronoi
Mapped: The Share Of Foreign-Born Residents In Every U.S. State

Mapped: The Share of Foreign-Born Residents in Every U.S. State
Map: Illinois' Foreign Born Population - Axios Chicago
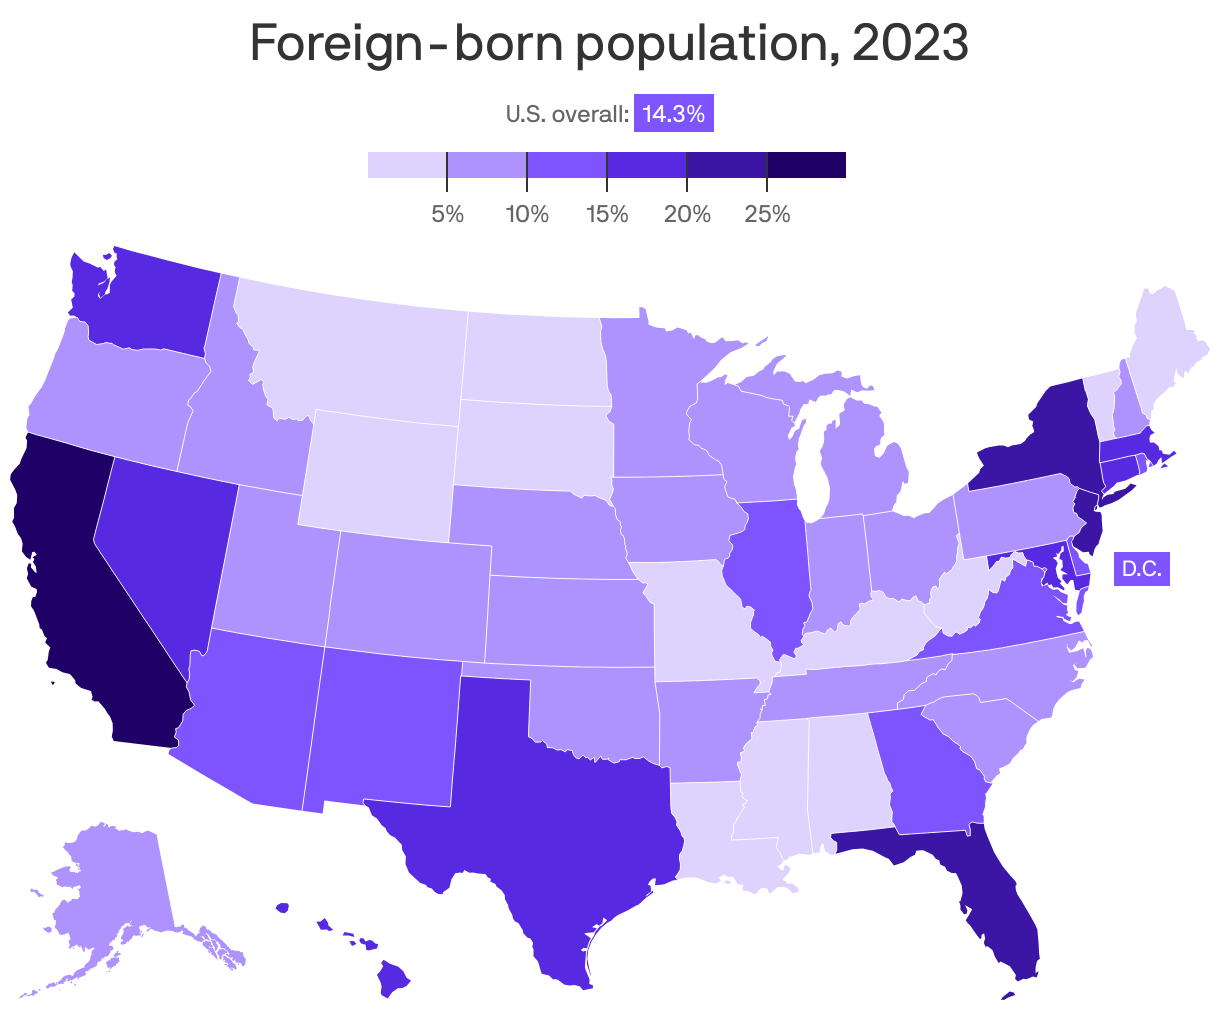
Map: Illinois' foreign born population - Axios Chicago
Us Map Labeled By Foreigners Why Did Much Less Immigrants Historically

Us Map Labeled By Foreigners Why Did Much Less Immigrants Historically
Foreign Born Population By State – QJLZ

Foreign Born Population By State – QJLZ
Foreign-Born Population As A Percent Of State Population 1960 About Two
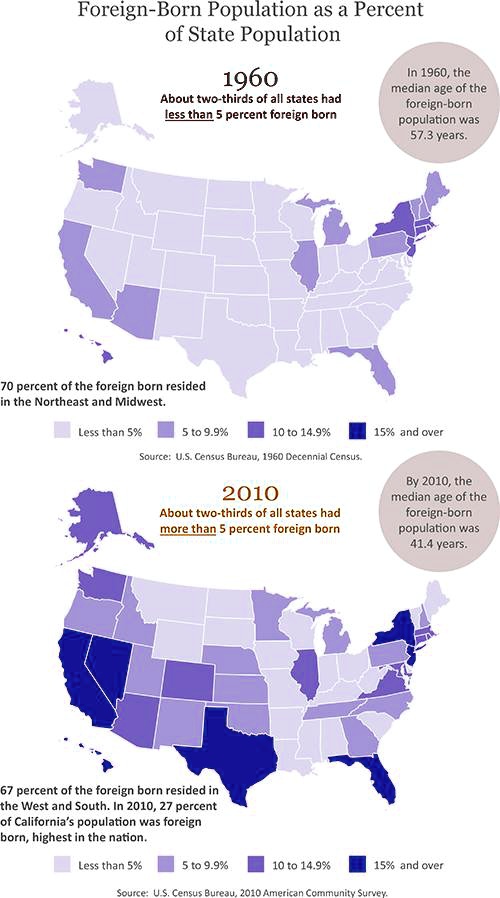
Foreign-Born Population as a Percent of State Population 1960 About two ...
Foreign Born Population, 2000 | Immigrant Entrepreneurship

Foreign Born Population, 2000 | Immigrant Entrepreneurship
The Foreign-Born Population In The U.S. Mapped - Vivid Maps

The Foreign-Born Population in the U.S. mapped - Vivid Maps
Us Map Of Population By State Map: How Each U.S. State's Population

Us Map Of Population By State Map: How Each U.S. State's Population
Foreign-Born Population By State In USA: Insights For 2025

Foreign-Born Population by State in USA: Insights for 2025
Map Of The Percentage Of Foreign-Born Population In Each U.S. State By

Map of the Percentage of Foreign-Born Population in Each U.S. State by ...
Map : A Map Of The Foreign-born Population In The United States (as A

Map : A map of the foreign-born population in the United States (as a ...
Maps Show States Where Foreign-Born Populations Are Rising Fastest
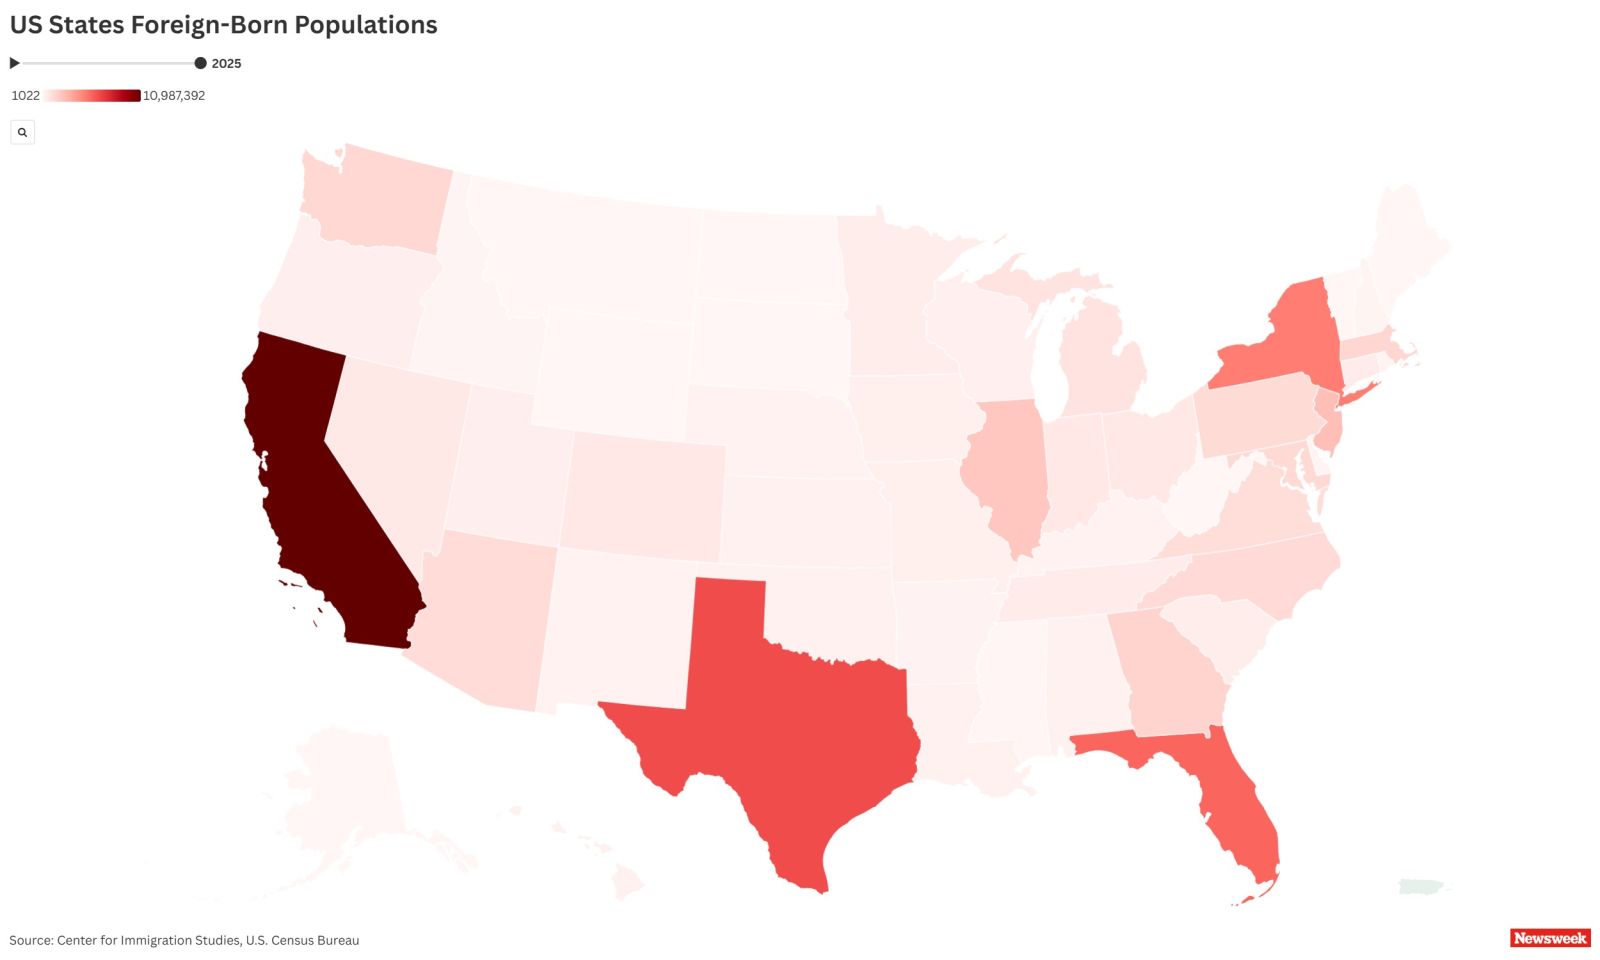
Maps Show States Where Foreign-Born Populations Are Rising Fastest ...
